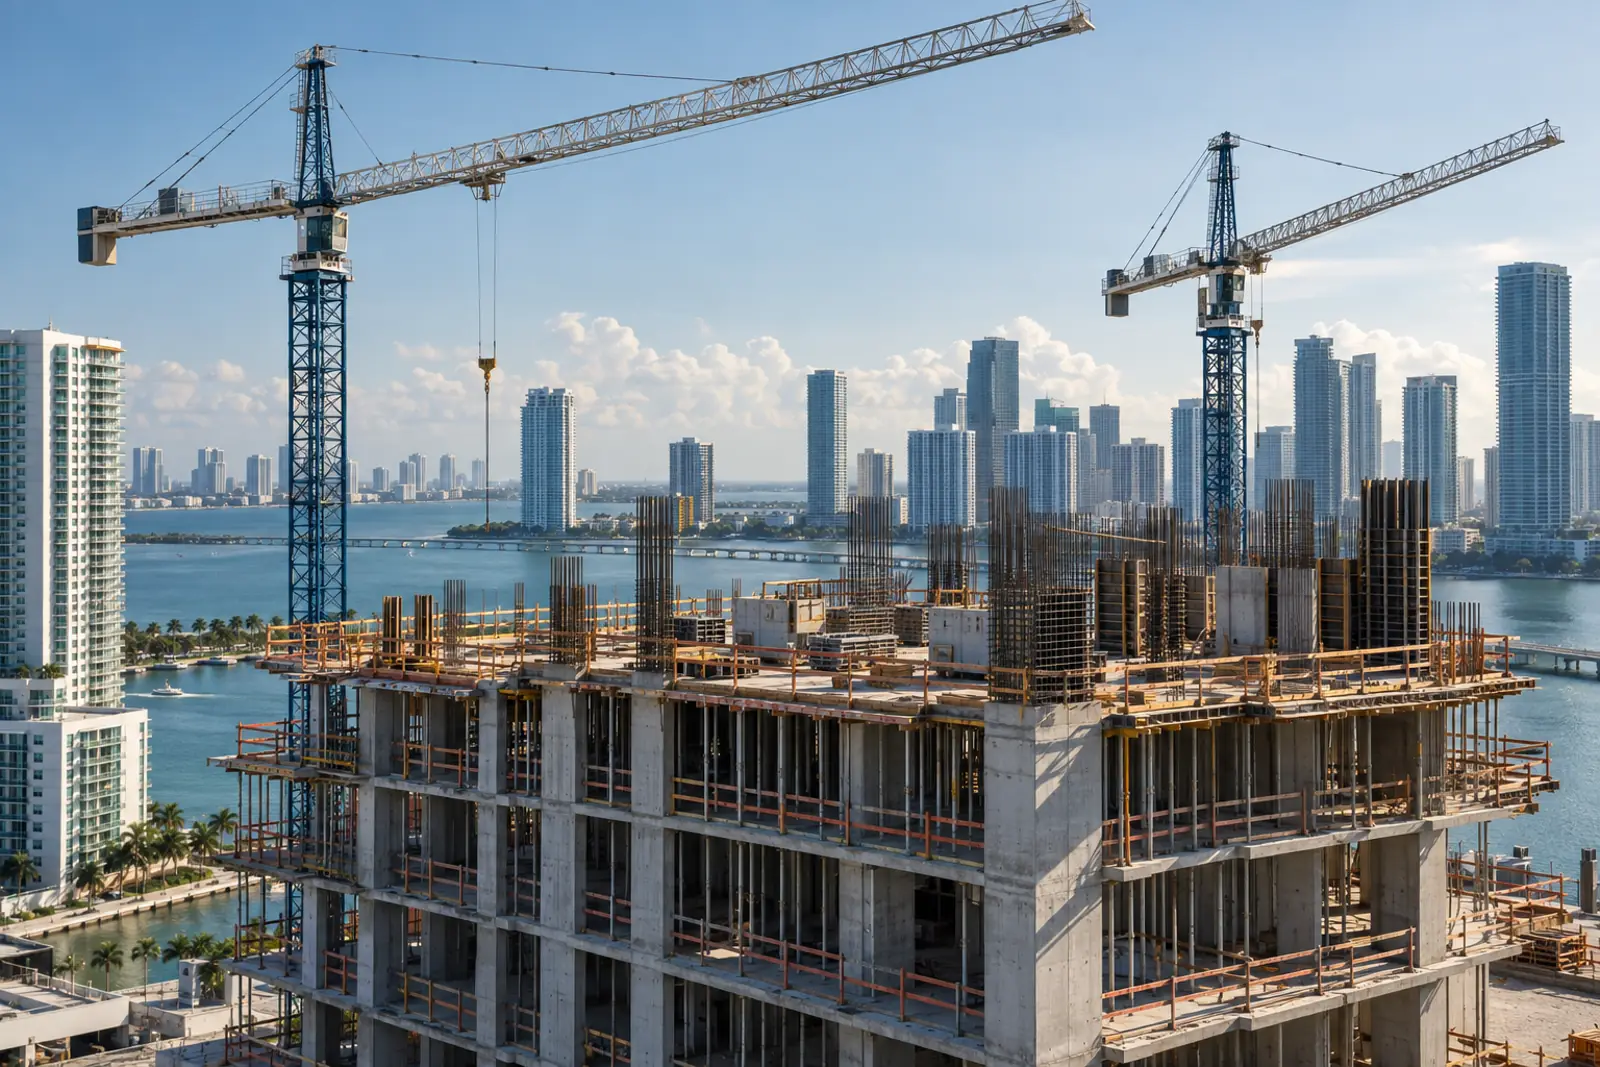
South Florida Commercial Construction: Miami-Dade, Broward and Palm Beach Market Data 2026
- Primary data
- BLS Quarterly Census of Employment and Wages (QCEW), NAICS 236220, private ownership
- Data period
- 2020 and 2025 annual averages; quarterly 2023 Q1 to 2026 Q1
- Latest release used
- 2026-08-28
- Next release
- 2026-12-02 (QCEW 2026 Q2)
- Geography
- Miami-Dade (12086), Broward (12011) and Palm Beach (12099) counties, Florida, United States
- Sources
- 26 (26 Tier 1)
South Florida commercial construction employed 15,977 private-sector workers at 1,335 commercial building contractor establishments (NAICS 236220) in Miami-Dade, Broward and Palm Beach counties in 2025, BLS data show. Jobs rose 23.0 percent from 2020, faster than the U.S. (17.2 percent) but slower than Florida (27.1 percent). March 2026 employment was 10.8 percent above March 2025.
The market in brief
- Miami-Dade, Broward and Palm Beach counties had 1,335 commercial and institutional building construction establishments (NAICS 236220) and 15,977 jobs in 2025, 31.0 percent of Florida's NAICS 236220 employment (BLS QCEW).
- The three counties hold 27.2 percent of Florida's population but 31.0 percent of its commercial building construction jobs, mainly because of Broward, which had 326.5 NAICS 236220 jobs per 100,000 residents in 2025, against 222.7 nationally.
- Miami-Dade is the largest county market by establishments (586) but the thinnest by jobs per resident (205.1 per 100,000) and the only one paying below the U.S. NAICS 236220 average (92.7 percent of the U.S. weekly wage in 2025).
- From 2020 to 2025, NAICS 236220 employment grew 23.0 percent across the three counties, led by Broward (38.6 percent), versus 27.1 percent for Florida and 17.2 percent for the U.S.
- In March 2026, three-county NAICS 236220 employment was 16,760, up 10.8 percent from March 2025, while all-construction employment in the same counties fell 1.0 percent (preliminary QCEW).
- Florida DBPR records list 13,337 current, active Certified General and Certified Building Contractor licenses with addresses in the three counties, about 10.0 per NAICS 236220 establishment, against 8.3 statewide.
- Miami-Dade and Broward form the Florida Building Code's High-Velocity Hurricane Zone; Palm Beach County does not, which gives the region two different envelope and product approval regimes within one metro area.
South Florida commercial construction at a glance
The three-county market is a 1,335-establishment, 15,977-job commercial building sector inside a 156,016-job construction industry. Miami-Dade has the most firms, Broward the most jobs, Palm Beach the fastest firm growth.
| Area | NAICS 236220 establishments | NAICS 236220 jobs | NAICS 236220 avg weekly wage | All construction (NAICS 23) jobs | Population (July 1, 2025) | Active CGC + CBC licenses |
|---|---|---|---|---|---|---|
| Miami-Dade | 586 | 5,746 | $1,910 | 59,626 | 2,802,029 | 5,726 |
| Broward | 407 | 6,573 | $2,228 | 53,210 | 2,013,317 | 4,100 |
| Palm Beach | 342 | 3,658 | $2,228 | 43,180 | 1,575,726 | 3,511 |
| Three-county total | 1,335 | 15,977 | $2,114 | 156,016 | 6,391,072 | 13,337 |
Private ownership, 2025 annual averages. Three-county weekly wage is employment-weighted from the county figures. Licenses: current, active CGC and CBC licenses by the county of the holder's address in the DBPR extract downloaded 2026-10-03.
Source: [1][2][3][8][13] U.S. Bureau of Labor Statistics; U.S. Bureau of Labor Statistics; U.S. Bureau of Labor Statistics; U.S. Census Bureau; Florida Department of Business and Professional Regulation
NAICS 236220 is the federal industry code for commercial and institutional building construction. It counts general contractors, design-build firms, construction managers and for-sale builders of commercial and institutional buildings (Census Bureau NAICS definition). Establishments doing specialized work on commercial buildings, generally on a subcontract basis, are classified separately as specialty trade contractors, so NAICS 236220 measures the general contractor layer rather than the full building workforce.
In 2025, Miami-Dade County had 586 private NAICS 236220 establishments employing 5,746 people (BLS QCEW, Miami-Dade). Broward County had 407 establishments and 6,573 jobs (BLS QCEW, Broward). Palm Beach County had 342 establishments and 3,658 jobs (BLS QCEW, Palm Beach).
Together the three counties held 27.1 percent of Florida's NAICS 236220 establishments and 31.0 percent of its NAICS 236220 jobs in 2025, against 27.2 percent of the state's July 2025 population (Census Vintage 2025). Commercial building contractors made up 10.2 percent of all construction jobs in the three counties, compared with 7.9 percent statewide.
Establishment: In QCEW, an establishment is an economic unit typically at one physical location, as distinct from a firm, which may have several establishments (BLS Handbook of Methods). QCEW excludes proprietors and the unincorporated self-employed (BLS QCEW overview).
For a profile of firms based in the city of Miami, see Miami commercial builders.
Miami-Dade, Broward and Palm Beach compared
Per resident, the three counties host slightly more commercial building contractors than the U.S. average. The job count per resident splits sharply: Broward is far above every benchmark, Miami-Dade below the U.S.
NAICS 236220 private establishments per 100,000 residents
Source: BLS QCEW 2025 annual averages; U.S. Census Bureau Vintage 2025 population estimates. CB&C calculation.
Palm Beach had 21.7 NAICS 236220 establishments per 100,000 residents in 2025, Miami-Dade 20.9 and Broward 20.2. Florida as a whole had 21.0 and the United States 17.1 (BLS QCEW 2025; Census Vintage 2025).
NAICS 236220 private employment per 100,000 residents
Source: BLS QCEW 2025 annual averages; U.S. Census Bureau Vintage 2025 population estimates. CB&C calculation.
Employment tells a different story. Broward had 326.5 NAICS 236220 jobs per 100,000 residents in 2025, Palm Beach 232.1 and Miami-Dade 205.1. The U.S. rate was 222.7. Broward's average NAICS 236220 establishment employed 16.1 people, against 9.8 in Miami-Dade and 10.7 in Palm Beach.
BLS publishes the same pattern as a location quotient: Broward's 2025 NAICS 236220 employment share was 1.56 times the national share, Palm Beach's 1.12 and Miami-Dade's 0.92 (BLS QCEW).
| Area | 236220 establishments per 100k residents | 236220 jobs per 100k residents | 236220 wage as % of U.S. 236220 wage | 236220 jobs per establishment | 236220 share of all construction jobs (%) | 236220 employment location quotient |
|---|---|---|---|---|---|---|
| Miami-Dade | 20.9 | 205.1 | 92.7 | 9.8 | 9.6 | 0.92 |
| Broward | 20.2 | 326.5 | 108.1 | 16.1 | 12.4 | 1.56 |
| Palm Beach | 21.7 | 232.1 | 108.1 | 10.7 | 8.5 | 1.12 |
| Three-county total | 20.9 | 250.0 | 102.6 | 12.0 | 10.2 | n/a |
| Florida | 21.0 | 219.7 | 98.0 | 10.5 | 7.9 | 1.06 |
| United States | 17.1 | 222.7 | 100.0 | 13.0 | 9.2 | 1.00 |
Derived from BLS QCEW 2025 annual averages (private) and Census Vintage 2025 population. Location quotient is published by BLS.
Source: [1][2][3][4][5][8] U.S. Bureau of Labor Statistics; U.S. Bureau of Labor Statistics; U.S. Bureau of Labor Statistics; U.S. Bureau of Labor Statistics; U.S. Bureau of Labor Statistics; U.S. Census Bureau
Miami-Dade vs Florida vs the United States
Miami-Dade has grown its firm count faster than its payrolls, and pays below the national NAICS 236220 average. Broward and Palm Beach pay above it. The region outgrew the U.S. over five years but trailed Florida.
NAICS 236220 average weekly wage as % of the U.S. 236220 average weekly wage
Source: BLS QCEW 2025 annual averages. CB&C calculation.
The 2025 average weekly wage in NAICS 236220 was $1,910 in Miami-Dade, $2,228 in Broward, $2,228 in Palm Beach, $2,020 in Florida and $2,061 in the United States (BLS QCEW, U.S.). Indexed to the U.S., Miami-Dade stood at 92.7, Florida at 98.0 and Broward and Palm Beach at 108.1 each.
Within each county, NAICS 236220 pays more than the private-sector average. In Miami-Dade the 2025 NAICS 236220 weekly wage was 122.0 percent of the total private wage of $1,565; in Broward it was 156.9 percent of $1,420 and in Palm Beach 141.6 percent of $1,574.
Percent change in private annual average employment
Source: BLS QCEW 2020 and 2025 annual averages. CB&C calculation.
Between 2020 and 2025, Miami-Dade NAICS 236220 establishments rose 23.6 percent but employment only 10.1 percent. Average firm size therefore fell. Miami-Dade all-construction employment rose 16.2 percent and total private employment 21.0 percent. Florida NAICS 236220 employment rose 27.1 percent and U.S. employment 17.2 percent.
| Area | 236220 jobs | 236220 establishments | 236220 avg weekly wage (nominal) | All construction jobs | Total private jobs | Population |
|---|---|---|---|---|---|---|
| Miami-Dade | 10.1 | 23.6 | 23.6 | 16.2 | 21.0 | 4.0 |
| Broward | 38.6 | 13.7 | 19.9 | 11.5 | 13.5 | 3.6 |
| Palm Beach | 20.6 | 30.5 | 33.3 | 17.7 | 16.9 | 5.5 |
| Three-county total | 23.0 | 22.0 | n/a | 15.0 | 17.7 | 4.2 |
| Florida | 27.1 | 29.1 | 33.1 | 16.7 | 19.3 | 8.7 |
| United States | 17.2 | 12.1 | 27.0 | 14.5 | 12.9 | 3.1 |
2020 was a pandemic-affected base year, which flatters growth for total private employment. Wages are nominal.
Source: [1][2][3][4][5][8] U.S. Bureau of Labor Statistics; U.S. Bureau of Labor Statistics; U.S. Bureau of Labor Statistics; U.S. Bureau of Labor Statistics; U.S. Bureau of Labor Statistics; U.S. Census Bureau
Occupational wage data give a worker-level view. In May 2025 the Miami-Fort Lauderdale-West Palm Beach metro had 18,280 construction laborers with an annual mean wage of $46,120, 88.6 percent of the U.S. mean of $52,030. Construction managers averaged $138,950, 111.7 percent of the U.S. mean of $124,360 (BLS OEWS May 2025).
| Occupation (SOC) | MSA employment | MSA annual mean wage | MSA annual median wage | U.S. annual mean wage | MSA mean as % of U.S. |
|---|---|---|---|---|---|
| Construction managers (11-9021) | not published | $138,950 | $126,110 | $124,360 | 111.7 |
| First-line supervisors, construction trades (47-1011) | 16,720 | $82,560 | $77,530 | $86,450 | 95.5 |
| Construction laborers (47-2061) | 18,280 | $46,120 | $45,520 | $52,030 | 88.6 |
| All construction and extraction occupations (47-0000) | 109,280 | $58,140 | $50,650 | $65,360 | 89.0 |
| All occupations (00-0000) | 2,819,940 | $67,190 | $48,640 | $69,770 | n/a |
BLS Occupational Employment and Wage Statistics, May 2025 estimates, released 2026-05-15. Cross-industry estimates. The MSA covers Miami-Dade, Broward and Palm Beach counties.
Source: [10][11][12] U.S. Bureau of Labor Statistics; U.S. Bureau of Labor Statistics; U.S. Bureau of Labor Statistics
Statewide comparisons for every Florida county and other states are in our state-by-state atlas of commercial builders.
Licensed contractor supply: CGC and CBC holders by county
South Florida has roughly ten active certified general or building contractor licenses for every commercial building contractor establishment, more than the state ratio. Miami-Dade licensees lean heavily toward the unlimited CGC license.
Florida's Construction Industry Licensing Board certifies contractors statewide. A certified general contractor (CGC) may contract for any work requiring licensure under Chapter 489. A certified building contractor (CBC) is limited to commercial and residential buildings of no more than 3 stories, plus remodeling of any building that does not affect structural members (Florida Statutes s. 489.105).
| Area | CGC licenses | CBC licenses | CGC + CBC | CGC share (%) | Licenses per 236220 establishment | Licenses per 100k residents |
|---|---|---|---|---|---|---|
| Miami-Dade | 5,148 | 578 | 5,726 | 89.9 | 9.8 | 204.4 |
| Broward | 3,412 | 688 | 4,100 | 83.2 | 10.1 | 203.6 |
| Palm Beach | 2,634 | 877 | 3,511 | 75.0 | 10.3 | 222.8 |
| Three-county total | 11,194 | 2,143 | 13,337 | n/a | 10.0 | 208.7 |
| Florida (Florida addresses) | 26,890 | 13,912 | 40,802 | 65.9 | 8.3 | 173.9 |
Current (status C), active (status A) licenses in the DBPR CILB licensee extract downloaded 2026-10-03. County is the county of the license holder's address of record, not where the holder works. A person can hold both licenses, and licenses cover residential and remodeling work as well as commercial.
Source: [13][14][15][1][2][3][4][8] Florida Department of Business and Professional Regulation; Florida Department of Business and Professional Regulation; Florida Department of Business and Professional Regulation; U.S. Bureau of Labor Statistics; U.S. Bureau of Labor Statistics; U.S. Bureau of Labor Statistics; U.S. Bureau of Labor Statistics; U.S. Census Bureau
The DBPR licensee extract downloaded on 2026-10-03 lists 5,148 current, active CGC licenses and 578 CBC licenses with Miami-Dade addresses, 3,412 and 688 in Broward, and 2,634 and 877 in Palm Beach (DBPR CILB licensee extract). CGC licenses made up 89.9 percent of the Miami-Dade total, against 75.0 percent in Palm Beach and 65.9 percent statewide.
Dividing the license count by the QCEW establishment count gives 9.8 licenses per NAICS 236220 establishment in Miami-Dade, 10.1 in Broward, 10.3 in Palm Beach and 8.3 for Florida-address licenses statewide. Per 100,000 residents, the three counties had 208.7 active CGC and CBC licenses, against 173.9 statewide.
Qualifier: DBPR's construction file also contains business records under occupation code QB (Construction Business Information). This report counts only individual CGC and CBC license rows, not QB business records.
High-Velocity Hurricane Zone and product approval: how regulation splits the market
Two of the three counties sit inside Florida's High-Velocity Hurricane Zone, with higher design wind speeds and a mandatory impact standard for the building envelope. Palm Beach builds under the statewide provisions.
The 2023 Florida Building Code (8th edition) defines the High Velocity Hurricane Zone as Broward and Miami-Dade counties (FBC 2023, Chapter 2). Palm Beach County is not in the zone. Our High-Velocity Hurricane Zone construction guide covers the technical requirements in detail; this section only notes how the rules shape the market.
Section 1620.2 sets HVHZ design wind speeds by risk category. For Risk Category II, the default category for buildings not listed in Categories I, III or IV, the speed is 175 mph in Miami-Dade and 170 mph in Broward. For Risk Category IV essential facilities, such as hospitals with surgery or emergency treatment and fire and police stations, it is 195 mph in Miami-Dade and 185 mph in Broward (FBC 2023, Chapter 16). Section 1626.1 requires exterior walls, roofs, doors, skylights, glazing and glass block to pass impact testing or be protected by a tested device.
Miami-Dade County's Product Control Section reviews an average of 1,250 product approval applications a year and conducts more than 850 quality assurance audits of manufacturers, fabricators and laboratories. A first-time product approval, known as a Notice of Acceptance (NOA), costs $4,000 and is valid for 5 years; revisions and renewals cost $1,500, plus a 7.5 percent surcharge on all fees (Miami-Dade Product Approval). Florida's statewide product approval statute names the Miami-Dade Product Control Division as an approved evaluation entity (Florida Statutes s. 553.842).
Quarterly trend: is South Florida commercial construction still growing in 2026?
Commercial building contractor payrolls in the three counties were higher in March 2026 than a year earlier, led by Broward. All-construction employment was flat to lower, so the 2026 gain is concentrated in the general contractor layer.
NAICS 236220 private employment in the third month of each quarter (not seasonally adjusted)
Source: BLS QCEW quarterly data, 2023 Q1 to 2026 Q1 (2026 Q1 preliminary, released 2026-08-28).
In March 2026, NAICS 236220 employment was 5,833 in Miami-Dade (1.3 percent year over year), 7,005 in Broward (21.0 percent) and 3,922 in Palm Beach (9.6 percent). Florida NAICS 236220 employment rose 3.9 percent and U.S. employment 3.2 percent (BLS County Employment and Wages, Q1 2026).
| Area | 236220 jobs, March 2025 | 236220 jobs, March 2026 | 236220 change (%) | 236220 establishments change (%) | All construction jobs change (%) | All construction jobs change (jobs) |
|---|---|---|---|---|---|---|
| Miami-Dade | 5,758 | 5,833 | 1.3 | 5.4 | 0.0 | 12 |
| Broward | 5,787 | 7,005 | 21.0 | 10.0 | -1.8 | -937 |
| Palm Beach | 3,579 | 3,922 | 9.6 | 5.9 | -1.4 | -624 |
| Three-county total | 15,124 | 16,760 | 10.8 | 6.9 | -1.0 | -1,549 |
| Florida | 50,457 | 52,437 | 3.9 | 5.6 | -3.0 | -19,730 |
| United States | 742,015 | 766,039 | 3.2 | 2.9 | 1.0 | 82,142 |
QCEW first quarter 2026, released 2026-08-28; data are preliminary. Employment is the third month of the quarter (March). Private ownership.
Source: [1][2][3][4][5][6] U.S. Bureau of Labor Statistics; U.S. Bureau of Labor Statistics; U.S. Bureau of Labor Statistics; U.S. Bureau of Labor Statistics; U.S. Bureau of Labor Statistics; U.S. Bureau of Labor Statistics
Broward's quarterly series swings widely within each year: its March 2024 level was 5,904 and its September 2024 level 7,733. A single year-over-year comparison for Broward should be read with that volatility in mind. Miami-Dade's series is the most stable of the three, between 5,635 and 6,047 in every quarter shown.
For broader construction, the monthly BLS CES series for the Miami-Fort Lauderdale-West Palm Beach metro shows 158.9 thousand construction jobs in August 2026, 0.4 percent below August 2025 and 11.0 percent above February 2020 (BLS CES via FRED). Nationally, Census estimated total construction spending at a seasonally adjusted annual rate of $2,203.1 billion in August 2026, 1.7 percent below August 2025 (Census C30); national spending is analysed in our national construction spending report.
Local benchmarks we calculated
Commercial building contractor density per 100,000 residents
FormulaNAICS 236220 establishments (or jobs), 2025 annual average / resident population July 1, 2025 x 100,000
Inputs: QCEW 2025 establishments and employment rows for each area; Census Vintage 2025 population rows (see derived_metrics.csv ids per100k_*) (fact sheet rows)
Result: Establishments: Miami-Dade 20.9, Broward 20.2, Palm Beach 21.7, Florida 21.0, U.S. 17.1. Jobs: Miami-Dade 205.1, Broward 326.5, Palm Beach 232.1, Florida 219.7, U.S. 222.7.
South Florida has about as many commercial building contractor sites per resident as Florida and more than the U.S. Payroll concentration is a Broward feature, not a regional one.
Limitations: Jobs are counted where the establishment reports, not where buildings go up; commuting and cross-county projects are not adjusted. U.S. population is the sum of 50 states and DC.
Wage benchmark: county NAICS 236220 weekly wage as % of U.S.
FormulaArea NAICS 236220 average weekly wage 2025 / U.S. NAICS 236220 average weekly wage 2025 x 100
Inputs: QCEW 2025 annual average weekly wage rows (derived ids wageidx_*) (fact sheet rows)
Result: Miami-Dade 92.7, Broward 108.1, Palm Beach 108.1, three counties 102.6, Florida 98.0.
Broward and Palm Beach commercial building contractors pay above the national industry average; Miami-Dade pays below it despite having the most establishments.
Limitations: Nominal wages, not adjusted for living costs. Average weekly wage includes salaried management and bonuses, and is affected by firm size mix.
Five-year growth, 2020 to 2025
Formula(2025 annual average / 2020 annual average - 1) x 100
Inputs: QCEW 2020 and 2025 annual employment, establishment and wage rows; Census 2020 and 2025 population (derived ids g5_*) (fact sheet rows)
Result: NAICS 236220 jobs: Miami-Dade 10.1, Broward 38.6, Palm Beach 20.6, three counties 23.0, Florida 27.1, U.S. 17.2 percent.
The region beat national growth but not statewide growth. Miami-Dade added firms much faster than jobs.
Limitations: 2020 is a pandemic-affected base. Single endpoints hide year-to-year movement: Broward's 2025 annual NAICS 236220 employment was down from 2024 per BLS's published over-the-year change.
Licensed CGC + CBC holders per NAICS 236220 establishment
Formula(current, active CGC licenses + CBC licenses by address county, October 2026) / NAICS 236220 establishments, 2025
Inputs: DBPR licensee extract counts; QCEW 2025 establishments (derived ids licper_*) (fact sheet rows)
Result: Miami-Dade 9.8, Broward 10.1, Palm Beach 10.3, three counties 10.0, Florida 8.3.
Each South Florida commercial building contractor site is matched by roughly ten licensed general or building contractors with a local address, a deeper qualifier pool than the state average.
Limitations: Mixes units (licenses vs worksites) and periods (October 2026 vs 2025 average). License county is the holder's address of record. Licenses include residential and remodeling scopes and inactive-in-practice holders.
Q1 2026 divergence: general contractors vs all construction
Formula(March 2026 employment / March 2025 employment - 1) x 100, NAICS 236220 vs NAICS 23, summed across three counties
Inputs: QCEW 2025 Q1 and 2026 Q1 month-3 employment rows (derived ids yoy_236220_m3_south_florida, yoy_23_m3_south_florida) (fact sheet rows)
Result: NAICS 236220 10.8 percent; NAICS 23 -1.0 percent.
Commercial building contractor payrolls rose while total construction payrolls fell, so the 2026 growth is concentrated in the prime contractor layer rather than across the trades.
Limitations: Preliminary 2026 data, subject to revision. Not seasonally adjusted, but the same month is compared.
What the numbers show
- NAICS 236220 employment in Miami-Dade, Broward and Palm Beach counties averaged 15,977 in 2025.[1][2][3]
- Miami-Dade had 586 NAICS 236220 establishments and 5,746 jobs in 2025; Broward had 407 and 6,573; Palm Beach had 342 and 3,658.[1][2][3]
- The three counties averaged 20.9 NAICS 236220 establishments per 100,000 residents in 2025, close to Florida (21.0) and above the U.S. (17.1).[1][2][3][4][5][8]
- Broward had 326.5 NAICS 236220 jobs per 100,000 residents in 2025, the highest of the three counties and above Florida (219.7) and the U.S. (222.7).[2][4][5][8]
- Miami-Dade had 205.1 NAICS 236220 jobs per 100,000 residents in 2025, below the U.S. rate.[1][5][8]
- The average NAICS 236220 weekly wage in 2025 was $2,228 in Broward and $2,228 in Palm Beach, each 108.1 percent of the U.S. average of $2,061.[2][3][5]
- Miami-Dade's 2025 NAICS 236220 average weekly wage was $1,910, 92.7 percent of the U.S. figure.[1][5]
- Broward NAICS 236220 employment rose 38.6 percent between 2020 and 2025, from 4,741 to 6,573.[2]
- Miami-Dade NAICS 236220 employment rose 10.1 percent between 2020 and 2025 while its NAICS 236220 establishment count rose 23.6 percent.[1]
- In March 2026, three-county NAICS 236220 employment was 10.8 percent higher than in March 2025, while three-county NAICS 23 employment was 1.0 percent lower (preliminary).[1][2][3][6]
- Florida DBPR data list 5,726 active CGC and CBC licenses with Miami-Dade addresses, 4,100 in Broward and 3,511 in Palm Beach (extract downloaded 2026-10-03).[13]
- Statewide, 40,802 active CGC and CBC licenses carry a Florida address; the three counties account for 32.7 percent of them.[13]
- Construction managers in the Miami-Fort Lauderdale-West Palm Beach metro earned an annual mean wage of $138,950 in May 2025, 111.7 percent of the U.S. mean; construction laborers earned $46,120, 88.6 percent of the U.S. mean.[10][11]
- The 2023 Florida Building Code defines the High Velocity Hurricane Zone as Broward and Miami-Dade counties; Palm Beach County is outside it.[18]
Questions people ask
How many commercial contractors are in Miami?
Miami-Dade County had 586 private commercial and institutional building construction establishments (NAICS 236220) in 2025, per BLS QCEW, and 610 in the first quarter of 2026 (preliminary). Florida DBPR lists 5,726 current, active CGC and CBC licenses with Miami-Dade addresses as of October 2026.
Is construction booming in South Florida?
Commercial building contractors are growing; construction as a whole is not. Three-county NAICS 236220 employment was 10.8 percent higher in March 2026 than a year earlier, but all-construction employment was 1.0 percent lower (preliminary QCEW), and metro CES construction employment in August 2026 was 0.4 percent below August 2025.
How much do construction workers make in Miami?
In May 2025, construction laborers in the Miami-Fort Lauderdale-West Palm Beach metro earned an annual mean wage of $46,120 and a median of $45,520; construction managers earned a mean of $138,950 (BLS OEWS). In Miami-Dade, the 2025 average weekly wage at commercial building contractors (NAICS 236220) was $1,910 (BLS QCEW).
What is the High-Velocity Hurricane Zone?
It is the area to which the Florida Building Code applies its High-Velocity Hurricane Zone provisions: Broward and Miami-Dade counties. The 2023 code sets Risk Category II design wind speeds of 175 mph in Miami-Dade and 170 mph in Broward and requires impact-tested envelope components. More detail: our High-Velocity Hurricane Zone construction guide.
How many licensed general contractors are in Florida?
The DBPR licensee extract downloaded on 2026-10-03 lists 30,545 current, active Certified General Contractor (CGC) licenses, of which 26,890 have a Florida address. It also lists 15,668 active Certified Building Contractor (CBC) licenses (13,912 with a Florida address).
Frequently asked questions
How many people work in South Florida commercial construction?
Commercial and institutional building contractors (NAICS 236220) in Miami-Dade, Broward and Palm Beach counties employed an annual average of 15,977 people in 2025 (BLS QCEW). All construction employed 156,016.
Which South Florida county has the most commercial contractors?
Miami-Dade, with 586 NAICS 236220 establishments in 2025, ahead of Broward (407) and Palm Beach (342).
Which county has the most commercial construction jobs?
Broward, with 6,573 NAICS 236220 jobs in 2025, compared with 5,746 in Miami-Dade and 3,658 in Palm Beach.
How fast has South Florida commercial construction grown since 2020?
Three-county NAICS 236220 employment rose 23.0 percent from 2020 to 2025 and establishments rose 22.0 percent (BLS QCEW).
How does South Florida compare with Florida and the U.S.?
South Florida's 2020 to 2025 NAICS 236220 job growth of 23.0 percent exceeded the U.S. (17.2 percent) but trailed Florida (27.1 percent).
What do commercial building contractors pay in South Florida?
The 2025 average weekly wage in NAICS 236220 was $1,910 in Miami-Dade, $2,228 in Broward and $2,228 in Palm Beach, against $2,061 nationally (BLS QCEW).
Is Palm Beach County in the High-Velocity Hurricane Zone?
No. The 2023 Florida Building Code defines the High Velocity Hurricane Zone as Broward and Miami-Dade counties only.
What does a Miami-Dade product approval (NOA) cost?
Miami-Dade County lists $4,000 for a first-time product approval, valid 5 years, and $1,500 for a revision or renewal, plus a 7.5 percent surcharge.
What is the difference between a CGC and a CBC license in Florida?
A certified general contractor may contract for any work requiring licensure under Chapter 489. A certified building contractor is limited to commercial and residential buildings of no more than 3 stories and to non-structural remodeling of larger buildings (Florida Statutes s. 489.105).
When will newer county data be available?
BLS is scheduled to release QCEW second quarter 2026 data on 2026-12-02. This report uses first quarter 2026 data released on 2026-08-28.
For journalists and researchers
If you cite only a few, cite these
- Commercial building contractors in Miami-Dade, Broward and Palm Beach counties employed 15,977 people in 2025, 23.0 percent more than in 2020.[1][2][3]
- Three-county commercial building construction employment was 10.8 percent higher in March 2026 than in March 2025, while all-construction employment was 1.0 percent lower.[1][2][3][6]
- Broward County had 326.5 commercial building construction jobs per 100,000 residents in 2025, against 222.7 nationally.[2][5][8]
Most quotable statistics
- Commercial building contractors in Miami-Dade, Broward and Palm Beach counties employed 15,977 people in 2025, 23.0 percent more than in 2020.[1][2][3]
- Three-county commercial building construction employment was 10.8 percent higher in March 2026 than in March 2025, while all-construction employment was 1.0 percent lower.[1][2][3][6]
- Broward County had 326.5 commercial building construction jobs per 100,000 residents in 2025, against 222.7 nationally.[2][5][8]
- Miami-Dade commercial building contractors paid an average $1,910 a week in 2025, 92.7 percent of the U.S. industry average.[1][5]
- Miami-Dade added 23.6 percent more commercial building contractor establishments from 2020 to 2025 but only 10.1 percent more jobs.[1]
- Florida DBPR lists 13,337 active certified general and building contractor licenses with addresses in Miami-Dade, Broward and Palm Beach counties, about 10.0 per commercial building contractor establishment.[13][1][2][3]
Press summary
Commercial Builders & Contractors analysed federal and state records for Miami-Dade, Broward and Palm Beach counties. Commercial and institutional building contractors (NAICS 236220) in the three counties employed 15,977 people at 1,335 establishments in 2025, according to the Bureau of Labor Statistics. Employment rose 23.0 percent from 2020, faster than the national 17.2 percent but slower than Florida's 27.1 percent. Broward stands out with 326.5 jobs per 100,000 residents and wages at 108.1 percent of the U.S. industry average; Miami-Dade has the most firms but pays 92.7 percent of the national average. Preliminary data for March 2026 show commercial building contractor jobs up 10.8 percent on the year while total construction employment fell 1.0 percent. State licensing records list 13,337 active certified general and building contractor licenses in the three counties, about 10.0 per commercial building contractor establishment. Miami-Dade and Broward sit inside the Florida Building Code's High-Velocity Hurricane Zone, which sets higher design wind speeds and impact testing for the building envelope; Palm Beach does not.
Suggested headlines
- South Florida commercial contractor jobs up 10.8% as wider construction slips
- Broward leads South Florida commercial construction with 38.6% five-year job growth
- Miami-Dade commercial builders pay 92.7% of U.S. average while Broward and Palm Beach pay more
- 13,337 licensed general and building contractors serve South Florida's 1,335 commercial builder sites
- South Florida outgrows the U.S. in commercial construction jobs but trails Florida
How to cite this report
Commercial Builders & Contractors. (2026). South Florida Commercial Construction: Miami-Dade, Broward and Palm Beach Market Data 2026. Retrieved from https://commercialbuildersandcontractors.com/south-florida-commercial-construction/
Reuse license
Data and tables are licensed CC BY 4.0. Attribution: “Source: Commercial Builders & Contractors, South Florida Commercial Construction: Miami-Dade, Broward and Palm Beach Market Data 2026” with a link to this page.
Download the data
Every table in this report is available as a CSV under CC BY 4.0. The fact sheet lists each value with its source URL and access date.
- derived_metrics.csv (CSV)
- fact_sheet.csv (CSV)
- South Florida commercial construction at a glance, 2025 (CSV)
- County comparison and benchmarks: density, pay and firm size, 2025 (CSV)
- Five-year change, 2020 to 2025 (percent) (CSV)
- Licensed contractor supply: active CGC and CBC licenses (CSV)
- Latest quarter: Q1 2026 vs Q1 2025 (CSV)
- Construction occupation wages, Miami-Fort Lauderdale-West Palm Beach MSA vs U.S., May 2025 (CSV)
Methodology
Source selection. County, state and national industry figures come from the BLS Quarterly Census of Employment and Wages (QCEW) open-data area files, which count every employer covered by unemployment insurance. We used private ownership (own code 5) rows for NAICS 236220 (commercial and institutional building construction), NAICS 23 (all construction) and industry code 10 (total private). Population comes from the Census Bureau Vintage 2025 county estimates (July 1 values). Occupational wages come from BLS OEWS May 2025. License counts come from the Florida DBPR Construction Industry Licensing Board licensee extract. Regulatory facts come from the 2023 Florida Building Code, Florida Statutes and Miami-Dade County's Product Control Section.
Inclusion and exclusion. Only sources opened during research on 2026-10-03 are cited. No QCEW cell used in this report was suppressed (all disclosure codes blank). Market research estimates, contractor rankings and unsourced social media statistics found in search results were excluded. National construction spending is cited once for context and analysed in a separate report.
License counts. We counted rows in the DBPR file with occupation code CGC or CBC, primary status C and secondary status A, grouped by the file's county code field (23 Miami-Dade, 16 Broward, 60 Palm Beach). We checked these codes by cross-tabulating city names (for example, code 23 is dominated by Miami, Hialeah, Coral Gables and Doral). County reflects the license holder's address of record, not the work location. The file was downloaded on 2026-10-03; DBPR says these files are refreshed weekly.
Conflicting numbers. QCEW annual averages and CES monthly estimates measure employment differently (a census of UI records vs a sample survey) and are not mixed in calculations. Where BLS publishes an over-the-year change, we recomputed it from levels and confirmed the match. Three-county wages are employment-weighted averages of county figures.
Derived metrics. Every ratio, share and growth rate is listed with its formula and input row numbers in derived_metrics.csv and can be reproduced with the scripts in the scripts folder. U.S. population is the sum of the 50 state and District of Columbia rows in the Census county file; QCEW U.S. totals also exclude Puerto Rico and the Virgin Islands.
Limitations. QCEW assigns jobs to the county where an establishment reports, so headquarters-heavy counties look denser. NAICS 236220 excludes trade subcontractors. First quarter 2026 data are preliminary. 2020 is a pandemic-affected base year. Wages are nominal. This report describes the market and is not investment, legal or licensing advice.
Last updated 2026-10-03. Next scheduled refresh after the BLS QCEW second quarter 2026 release on 2026-12-02.
This report presents published data with its limitations. It is not legal, financial or investment advice.
Sources, ranked by quality
Tier 1: primary and official sources (26)
- [1] U.S. Bureau of Labor Statistics. BLS QCEW open data, Miami-Dade County (FIPS 12086) area files. 2020, 2025 annual; 2023 Q1 to 2026 Q1. Accessed 2026-10-03.
- [2] U.S. Bureau of Labor Statistics. BLS QCEW open data, Broward County (FIPS 12011) area files. 2020, 2025 annual; 2023 Q1 to 2026 Q1. Accessed 2026-10-03.
- [3] U.S. Bureau of Labor Statistics. BLS QCEW open data, Palm Beach County (FIPS 12099) area files. 2020, 2025 annual; 2023 Q1 to 2026 Q1. Accessed 2026-10-03.
- [4] U.S. Bureau of Labor Statistics. BLS QCEW open data, Florida statewide (FIPS 12000) area files. 2020, 2025 annual; 2023 Q1 to 2026 Q1. Accessed 2026-10-03.
- [5] U.S. Bureau of Labor Statistics. BLS QCEW open data, U.S. total (US000) area files. 2020, 2025 annual; 2023 Q1 to 2026 Q1. Accessed 2026-10-03.
- [6] U.S. Bureau of Labor Statistics. County Employment and Wages, First Quarter 2026 (USDL-26-1424). 2026 Q1 (released 2026-08-28). Accessed 2026-10-03.
- [7] U.S. Bureau of Labor Statistics. QCEW release calendar. 2026 schedule. Accessed 2026-10-03.
- [8] U.S. Census Bureau. County Population Totals and Components of Change: 2020-2025 (CO-EST2025-alldata). July 1, 2020 to July 1, 2025. Accessed 2026-10-03.
- [9] U.S. Census Bureau. County Population Totals: 2020-2025 (Vintage 2025 release page). Vintage 2025 (March 2026). Accessed 2026-10-03.
- [10] U.S. Bureau of Labor Statistics. OEWS May 2025 metropolitan area estimates (oesm25ma.zip). May 2025. Accessed 2026-10-03.
- [11] U.S. Bureau of Labor Statistics. OEWS May 2025 national estimates (oesm25nat.zip). May 2025. Accessed 2026-10-03.
- [12] U.S. Bureau of Labor Statistics. Occupational Employment and Wages, May 2025 (USDL-26-0725). May 2025 (released 2026-05-15). Accessed 2026-10-03.
- [13] Florida Department of Business and Professional Regulation. Construction Industry Licensing Board licensee extract (CONSTRUCTIONLICENSE_1.csv). Extract downloaded 2026-10-03. Accessed 2026-10-03.
- [14] Florida Department of Business and Professional Regulation. Construction Industry Public Records (file layout and inclusion rules). 2026. Accessed 2026-10-03.
- [15] Florida Department of Business and Professional Regulation. Understanding DBPR Codes. 2026. Accessed 2026-10-03.
- [16] Florida Department of Business and Professional Regulation. Public Records ReadMe/Disclaimer. 2026. Accessed 2026-10-03.
- [17] Florida Legislature. Florida Statutes s. 489.105, Definitions (2026). 2026 Florida Statutes. Accessed 2026-10-03.
- [18] Florida Building Commission (hosted by International Code Council). 2023 Florida Building Code, Building, 8th Edition, Chapter 2 Definitions. 2023 FBC, 8th edition. Accessed 2026-10-03.
- [19] Florida Building Commission (hosted by International Code Council). 2023 Florida Building Code, Building, 8th Edition, Chapter 16 Structural Design. 2023 FBC, 8th edition. Accessed 2026-10-03.
- [20] Miami-Dade County Department of Regulatory and Economic Resources. Product Approval (Product Control Section). Current page, 2026. Accessed 2026-10-03.
- [21] Florida Legislature. Florida Statutes s. 553.842, Product evaluation and approval (2026). 2026 Florida Statutes. Accessed 2026-10-03.
- [22] U.S. Census Bureau. NAICS 236220 Commercial and Institutional Building Construction (2022 NAICS). 2022 NAICS. Accessed 2026-10-03.
- [23] U.S. Census Bureau. Monthly Construction Spending, August 2026 (CB26-158). August 2026 (released 2026-10-01). Accessed 2026-10-03.
- [24] U.S. Bureau of Labor Statistics. QCEW Overview. Current page. Accessed 2026-10-03.
- [25] U.S. Bureau of Labor Statistics. Handbook of Methods: Quarterly Census of Employment and Wages, Concepts. Current page. Accessed 2026-10-03.
- [26] U.S. Bureau of Labor Statistics via Federal Reserve Bank of St. Louis (FRED). All Employees: Construction in Miami-Fort Lauderdale-West Palm Beach, FL (MSA), SMU12331002000000001SA. Through August 2026. Accessed 2026-10-03.