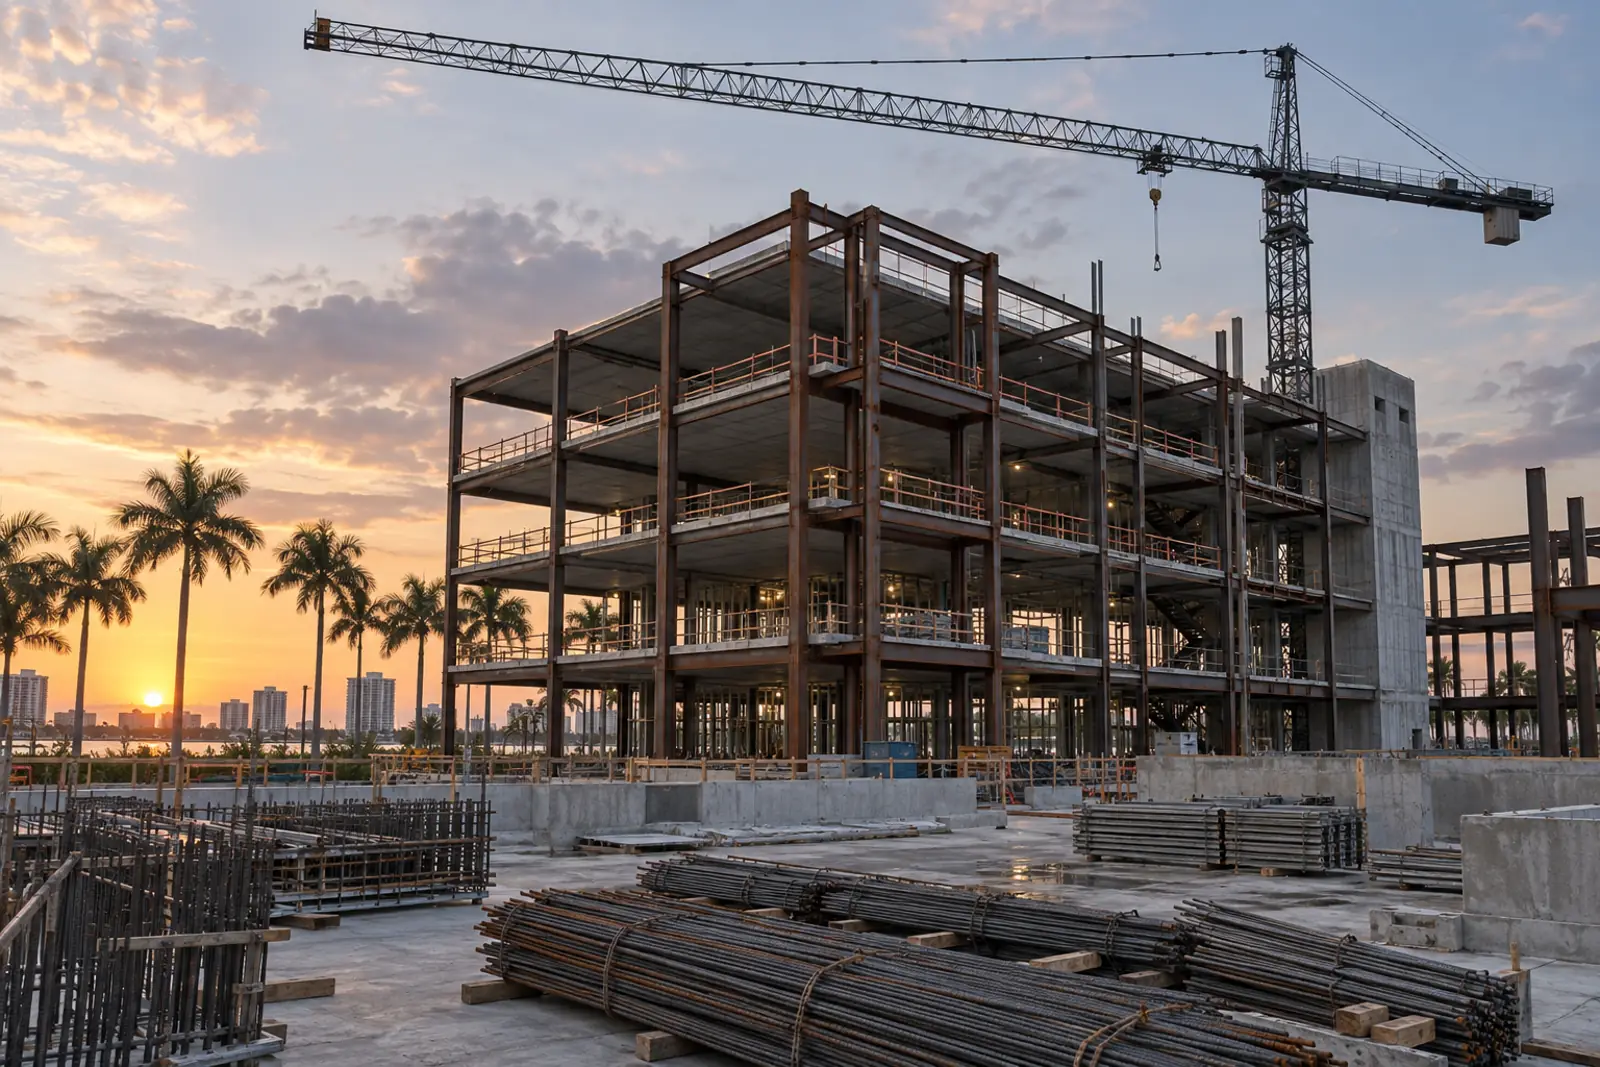
Commercial Construction Cost Per Square Foot: 2026 Data and Drivers
Commercial construction cost per square foot depends mostly on building type, location and finish level. Rider Levett Bucknall's Q3 2026 report puts Miami hard costs at $80 to $160 for warehouses, $265 to $455 for prime offices and $520 to $735 for general hospitals, before soft costs, contingency and escalation.
What published data says about commercial construction cost per square foot
Very few organizations publish per-square-foot construction costs for free, and the ones that do measure different things. The most useful public set is the quarterly cost report from Rider Levett Bucknall (RLB), an international cost consultancy. Its Q3 2026 North America report lists indicative hard construction costs per square foot of gross floor area for 18 U.S. cities across offices, retail, hotels, hospitals, industrial, parking, housing and schools. RLB notes that costs vary with site conditions, climate, standards of specification and market conditions, so treat each range as a starting band rather than a quote.
For Miami, the Florida city in the report, RLB's published ranges include $80 to $160 for warehouses, $265 to $455 for prime offices and $520 to $735 for a general hospital, with secondary offices at $175 to $245. The same RLB report also covers retail, hotels and schools; read the ranges there rather than a copy here. All of these are hard costs. They leave out land, design fees, permits, financing, furniture, equipment and the owner's own contingency.
Geography moves the band as much as building type does. In the same report a prime office runs $435 to $1,010 per square foot in New York, against $265 to $445 in Dallas and $265 to $455 in Miami. Miami's ranges sit close to the Texas cities, not the coastal gateway markets, even though South Florida carries some of the strictest wind rules in the country.
For interior build-outs, the best public benchmark is Cushman & Wakefield's 2026 Americas Office Fit Out Cost Guide. It puts the U.S. average office fit-out at $162 per square foot and the Americas average at $149, up 5.5% in a year, with electrical work the largest single share of fit-out cost at 24%. If you are budgeting a lease rather than a building, read our tenant improvement allowance guide next.
| Source | What it measures | Latest headline figure | Period |
|---|---|---|---|
| RLB Quarterly Cost Report | Indicative hard cost per sq ft of gross floor area, by city and building type | Miami prime office $265 to $455; Miami warehouse $80 to $160 | Q3 2026 |
| RLB National Construction Cost Index | Change in construction cost, national | 292.28, up 4.45% year over year | July 2026 |
| Turner Building Cost Index | Nonresidential building cost, national | 1552, up 5.15% year over year | Q2 2026 |
| Mortenson Construction Cost Index | Nonresidential building cost in eight markets | Up 5.60% over 12 months | Published Sept. 8, 2026 |
| Cushman & Wakefield Fit Out Cost Guide | Office interior fit-out cost per sq ft | U.S. average $162; Americas average $149 | 2026 edition |
| BLS Producer Price Index (WPU801) | Price of new nonresidential buildings | Up 5.3% over 12 months | August 2026 |
Only the RLB and Cushman figures are dollars per square foot. The indexes measure change over time and are used to escalate older figures. CB&C quotes headline figures only; see each source for its method.
RLB's 3-star and 5-star hotel ranges for all 18 U.S. cities, with HVS per-room medians, are tabulated in our hotel construction cost guide.
Cost drivers by building type
Two buildings with the same floor area can differ in cost by a factor of several times, because the money goes into different systems. The share spent on structure, envelope, mechanical, electrical and plumbing (MEP) and code-driven features is what separates a warehouse from a hospital. The table below pairs the main drivers for each type with the BLS producer price index for that building type, which tracks what builders charge for the same kind of building over time.
| Building type | Main cost drivers | BLS PPI, 12 months to Aug 2026 | BLS PPI, since Jan 2020 |
|---|---|---|---|
| Office | Envelope, elevators, MEP systems, floor-to-floor height, lobby finishes | +5.9% | +54.4% |
| Warehouse | Clear height, slab design, roof structure, dock doors, fire sprinklers | +4.3% | +50.6% |
| Industrial | Heavy slabs, process utilities, power service, crane loads | +5.8% | +49.0% |
| Health care | Air changes, medical gas, emergency power, shielding, infection control | +5.0% | +41.5% |
| School | Assembly spaces, durable finishes, life safety, public procurement rules | +5.2% | +40.0% |
| All new nonresidential | Weighted mix of the above | +5.3% | +46.3% |
BLS producer price indexes for new industrial, warehouse, school, office and health care building construction, plus WPU801 for all new nonresidential buildings, not seasonally adjusted. Cost drivers are general descriptions, not measured shares.
Warehouses and industrial buildings are mostly slab, structure and roof. Cost moves with clear height, column spacing, slab thickness for racking and forklifts, dock positions and fire sprinkler design. Because the interior is simple, steel and concrete prices carry more weight here than in any other type. Our warehouse construction page covers the scope in detail.
Offices split into core and shell versus tenant interiors. The spread between RLB's secondary and prime office ranges mostly reflects envelope quality, lobby and elevator finishes, mechanical systems and floor-to-floor height. On multi-tenant buildings, the owner often funds the shell and negotiates interiors with each tenant.
Medical and health care buildings are MEP-heavy: more air changes, medical gas, emergency power, imaging shielding and infection control during construction. That is why RLB's hospital ranges are the highest in the Miami row. Outpatient medical offices sit between a standard office and a hospital; see medical office construction.
Retail and restaurants depend on who builds what. Landlords usually deliver a shell or a vanilla box, and the tenant pays for the fit-out. Kitchens, grease interceptors, hoods and walk-in coolers sit on the tenant's side of that split, so a restaurant fit-out budget carries them on top of the shell. Schools carry assembly spaces, durable finishes and public-procurement rules that add design and bonding requirements.
BLS producer price indexes, January and July readings plus August 2026
Source: U.S. Bureau of Labor Statistics, Producer Price Indexes (August 2026 release); rebased by CB&C Research
The chart shows how far each building type's price level has moved since January 2020. The office index is up 54.4%, warehouses 50.6%, industrial buildings 49.0%, health care 41.5% and schools 40.0%. In the 12 months to August 2026, prices for all new nonresidential buildings rose 5.3%. Any cost figure older than a year needs to be escalated before you use it; the CB&C Construction Price Index updates these series every month.
Fire protection is priced as its own line in public school estimates, and the per-square-foot figures are broken down in our fire sprinkler system cost guide.
Roofing is one of the few envelope lines with public unit prices; our guide to TPO roofing cost per square foot compiles them from bid tabulations.
Material and labor prices behind the number
Builders buy materials and subcontracted trade work, then sell finished buildings. BLS measures both sides. Prices for inputs to new nonresidential construction rose 8.9% in the 12 months to August 2026, faster than the 5.3% rise in prices for finished nonresidential buildings. When inputs outrun outputs, contractors either absorb the difference or pass it through on the next bid, so expect bid prices to keep catching up.
BLS commodity producer price indexes, percent
Source: U.S. Bureau of Labor Statistics, Producer Price Indexes (August 2026, preliminary)
The spread between materials is wide. Diesel fuel rose 77.8% over the year, aluminum mill shapes 27.3%, copper wire and cable 27.2% and steel mill products 23.4%, while ready-mix concrete rose 2.3%, insulation 1.1% and gypsum products 0.2%. Switchgear rose 12.3% and transformers 7.6%. In practice this means metal-heavy scopes such as structural steel, storefront framing, electrical gear and roofing move a budget far more than drywall and concrete interiors do.
Labor is the other half. Average hourly earnings in nonresidential building construction reached $47.35 in August 2026, up 5.2% from a year earlier. Turner Construction, announcing its Q2 2026 Building Cost Index, said the industry's biggest challenge remains the availability of skilled mechanical and electrical labor. Mortenson's Q3 2026 index shows the same split from the contractor's side: materials up 6.0% and trade partner work up 5.2% over 12 months.
The private indexes agree on direction. RLB's national index rose 4.45% year over year to 292.28 in July 2026, Turner's index rose 5.15% to 1552 in Q2 2026 and Mortenson's rose 5.60% over 12 months. A planning escalation rate somewhere in that band is consistent with every published source we could open.
Regional labor costs and why Florida prices differently
Wages explain a large part of the gap between cities. Using BLS occupational wage data for seven core construction occupations, weighted by national employment, the average construction wage basket was $72,524 in May 2025. Florida's big metros all sit below it: Miami $65,499, Tampa $62,956, Jacksonville $62,749 and Orlando $61,489. San Jose tops the large metros at $104,550.
Employment-weighted mean annual wage across seven construction occupations
Source: U.S. Bureau of Labor Statistics, OEWS May 2025 metropolitan estimates; CB&C Research employment weighting
Lower wages do not automatically mean a cheaper building. RLB's comparative cost index for Miami rose 4.55% in the year to July 2026, slightly faster than its national index. South Florida also builds under the Florida Building Code's High-Velocity Hurricane Zone rules, which cover Broward and Miami-Dade counties and add requirements for impact-rated openings, roofing and structural connections. Our guide to HVHZ construction explains how those rules show up in a budget, and the construction pay by metro report has the full wage ranking.
Soft costs to add to the hard cost
Hard costs are what the builder charges to put the building in place. Soft costs are everything else the owner pays to get a usable building. Published per-square-foot ranges almost never include them, and they vary too much by project to reduce to one percentage, so price each line separately.
- Design and engineering. Architect, structural, MEP and civil engineers, plus specialty consultants such as kitchen, acoustic or medical planners.
- Permits and plan review. Building permit and plan review fees, utility connection fees and any local impact fees. See our commercial building permits guide.
- Site studies. Boundary and topographic survey, geotechnical report, environmental assessment and, near water, flood elevation work.
- Inspections and testing. Special inspections, materials testing and, on Florida threshold buildings, the threshold inspector.
- Insurance and bonds. Builder's risk, owner's liability and any payment and performance bond premiums the contract requires.
- Financing. Construction loan interest during the build, lender fees and the lender's inspection and draw costs.
- Legal and recording. Contract review, title work and recording a Notice of Commencement in Florida.
- Furniture, fixtures and equipment. Furniture, IT cabling, security, audiovisual and owner-supplied equipment.
- Commissioning and move-in. Systems commissioning, owner training, moving and start-up costs.
Florida public school boards publish what they pay for this cover in their board records, as our builder's risk insurance cost and coverage guide shows.
Contingency: how public owners set it
Contingency is money you expect to spend but cannot yet assign to a line. The clearest public guideline comes from the U.S. General Services Administration's P120 cost and schedule management policy, which federal building projects follow. It separates a design contingency, which covers elements that are expected but not yet drawn, from a construction contingency, which covers changes during construction such as unforeseen site conditions. Scope changes are funded separately and are not supposed to come out of either.
| Design stage | Design contingency, new construction | Design contingency, repair and alteration |
|---|---|---|
| Planning and development | 10% | 10% |
| Concept design | 7.5% to 10% | 10% to 15% |
| Design development | 5% to 7.5% | 7.5% to 10% |
| 75% construction documents | 2% to 5% | 3.5% to 7.5% |
| 90% construction documents | 1% to 3% | 1.5% to 3.5% |
| Final construction documents | 0% | 0% |
| Construction contingency (separate) | 7% of estimated construction cost at award | 10% for modernization and repair and alteration |
Design contingency is a percentage of direct cost; construction contingency is a percentage of the estimated construction cost at award. Federal policy, shown here as a public benchmark.
The pattern matters more than the exact numbers. Design contingency starts at 10% at planning and falls to zero when construction documents are final, because uncertainty shrinks as the drawings fill in. Construction contingency stays at 7% for new construction and 10% for modernization, reflecting the extra unknowns in existing buildings. In a published Q&A, GSA added that contingencies should be set by the level of risk in a project. Private owners set their own amounts, but these figures are a documented public benchmark.
Escalation is handled separately. P120 tells estimators to escalate the estimate to the midpoint of construction, on the reasoning that roughly half the work happens before that point and half after, and to base the rate on a market study.
How to build a budget range step by step
- Fix the program and gross area.
List the spaces, uses and gross square footage, including walls, stairs and mechanical rooms. Per-square-foot figures are quoted on gross floor area.
- Pick a matching published range.
Use the building type, city and quality level closest to yours. If your city is not listed, use the nearest comparable market and say so in the budget notes.
- Adjust for site and code.
Note soil, flood zone, hurricane zone, demolition and utility conditions that the published range cannot know about.
- Add design contingency for your stage.
The less complete the drawings, the higher it should be. The GSA table above is a public reference.
- Escalate to the construction midpoint.
Apply a current annual rate from the indexes on this page for the months between the price date and the midpoint of construction.
- Add construction contingency.
Hold it for changes during the build, not for adding scope.
- Price soft costs line by line.
Use quotes and fee schedules rather than a blanket percentage.
- Test the range with builders early.
A preconstruction estimate from a builder who knows your market is worth more than any published average. Our guide on how to choose a commercial contractor explains how to compare them.
The table below runs that method on an invented project so you can see the arithmetic. It is an illustration, not market data and not a quote: a 20,000 square foot secondary office in Miami at concept design, using RLB's range, GSA's guideline contingencies and the low and high ends of the private escalation indexes.
| Step | Low | High | Basis |
|---|---|---|---|
| Hard cost | $3,500,000 | $4,900,000 | RLB Q3 2026 Miami secondary office, $175 and $245 per sq ft |
| Design contingency at concept design | $262,500 | $490,000 | GSA guideline, 7.5% and 10% |
| Subtotal | $3,762,500 | $5,390,000 | |
| Escalation, 12 months to construction midpoint | $167,431 | $301,840 | RLB 4.45% and Mortenson 5.60% annual rates |
| Subtotal | $3,929,931 | $5,691,840 | |
| Construction contingency | $275,095 | $398,429 | GSA guideline for new construction, 7% |
| Construction budget before soft costs | $4,205,026 | $6,090,269 | |
| Per square foot | $210.25 | $304.51 | Divided by 20,000 sq ft |
Hypothetical project. Illustration, not market data and not a quote. Soft costs, land and financing are excluded and must be priced separately.
The result is a construction budget of roughly $4.2 million to $6.1 million, about $210 to $305 per square foot, before soft costs. The width of that band is normal at concept stage. It narrows as drawings progress and as builders price real quantities, which is one reason delivery method matters; see design-build vs design-bid-build for how early builder involvement changes cost certainty.
Where commercial building spending is moving in 2026
Census Bureau data show private nonresidential construction spending at a seasonally adjusted annual rate of $773.0 billion in August 2026, 1.0% lower than a year earlier. The total hides big differences: data center spending rose 73.2% to $85.0 billion, while office excluding data centers fell 9.4%, warehouses 8.1% and manufacturing 19.8%.
Spending trends do not set your price directly, but they shape competition for crews. A sector where spending is falling can produce more bidders per job, while a boom elsewhere pulls electricians and mechanical trades toward the projects that pay most. The monthly commercial construction spending tracker follows each building type.
Turning a per-square-foot figure into real bids
A per-square-foot number is a screening tool. It tells you whether a project is feasible and roughly what to borrow, but only a priced scope from a builder tells you what you will pay. Once you have a range, map the phases in our commercial construction process guide, then line up bids for your new commercial construction project and compare them with our bid comparison method. More owner guides are collected on the guides hub.
The gas load, circuits and grease interceptor behind that cost are broken down in our commercial kitchen equipment guide.
For the slab line alone, public bids put concrete slab cost per square foot at about $10 to $16 installed in 2026.
Frequently asked questions
What is the average commercial construction cost per square foot in 2026?
There is no single reliable national average, because building type and city move the number more than anything else. Rider Levett Bucknall's Q3 2026 report gives Miami hard-cost ranges of $80 to $160 per square foot for warehouses, $265 to $455 for prime offices and $520 to $735 for general hospitals. National cost indexes rose between 4.45% and 5.60% over the past year.
Why do published cost ranges differ so much?
They measure different things. Some quote hard cost only, some include fit-out, some cover a single city or quality level, and some are indexes that track change rather than dollars. Always check whether a figure is hard cost or total project cost, which city it describes and how old it is.
How much do soft costs add to a commercial building?
It varies too much by project for a single percentage to be useful, and we could not find a reliable public benchmark. Price each soft cost line separately: design fees, permits, studies, inspections, insurance, financing, legal, furniture and equipment, and commissioning.
How much contingency should I carry?
Federal GSA policy is a useful public reference: design contingency of 10% at planning, falling to 0% at final construction documents, plus a construction contingency of 7% for new buildings and 10% for modernization work. Your own figure should reflect the risks on your site and the completeness of your drawings.
Are commercial construction costs still rising?
Yes. BLS prices for new nonresidential buildings rose 5.3% in the 12 months to August 2026, while input prices rose 8.9%. Turner's index rose 5.15% to Q2 2026 and Mortenson's 5.60% over 12 months to its September 2026 release.
Is it cheaper to build in Florida than elsewhere?
Construction wages in Miami, Tampa, Orlando and Jacksonville are below the national average, but that does not make every building cheaper. RLB's Miami ranges are close to Dallas, its Miami index rose 4.55% in a year, and Broward and Miami-Dade build under High-Velocity Hurricane Zone rules that add envelope requirements.
What does an office fit-out cost per square foot?
Cushman & Wakefield's 2026 guide puts the U.S. average office fit-out at $162 per square foot, with electrical work the largest share at 24% of cost. Actual cost depends on the condition of the space, finish level and the market.
How accurate is a per-square-foot estimate at the start of a project?
It is a screening figure. GSA policy carries up to 10% design contingency at the planning stage for new construction because so much is still undefined. Accuracy improves as drawings develop and builders price actual quantities.
Sources
- [1] Rider Levett Bucknall. Quarterly Construction Cost Report, North America, Third Quarter 2026 (PDF). Accessed 2026-10-07.
- [2] Rider Levett Bucknall. RLB Construction Cost Report North America Q3 2026. Accessed 2026-10-07.
- [3] Cushman & Wakefield. Office Fit-Out Costs Across the Americas Rise 5.5% as Contractors Expect Further Increases. Accessed 2026-10-07.
- [4] Turner Construction Company. Second Quarter 2026 Turner Building Cost Index. Accessed 2026-10-07.
- [5] Mortenson. Construction Cost Index: 3rd Quarter 2026. Accessed 2026-10-07.
- [6] U.S. Bureau of Labor Statistics. PPI industry data for construction (pc.data.75.Construction). Accessed 2026-10-03.
- [7] U.S. Bureau of Labor Statistics. PPI commodity data for construction, incl. WPU801 (wp.data.80.Construction). Accessed 2026-10-03.
- [8] U.S. Bureau of Labor Statistics. PPI inputs to construction industries (wp.data.80i.ConstructnInputs). Accessed 2026-10-03.
- [9] U.S. Bureau of Labor Statistics. PPI commodity data, current year (wp.data.0.Current). Accessed 2026-10-03.
- [10] U.S. Bureau of Labor Statistics. Producer Price Indexes, August 2026 (news release). Accessed 2026-10-03.
- [11] U.S. Bureau of Labor Statistics. Current Employment Statistics, construction hours and earnings (ce.data.20b). Accessed 2026-10-03.
- [12] U.S. Census Bureau. Monthly Construction Spending, August 2026. Accessed 2026-10-03.
- [13] U.S. Census Bureau. Value of Private Construction Put in Place, Seasonally Adjusted Annual Rate (privsatime.xlsx). Accessed 2026-10-03.
- [14] U.S. Bureau of Labor Statistics. OEWS May 2025 metropolitan area estimates (oesm25ma.zip). Accessed 2026-10-03.
- [15] U.S. General Services Administration. P120, Public Buildings Service Cost and Schedule Management Policy Requirements (PBS 1000.6B). Accessed 2026-10-07.
- [16] U.S. General Services Administration. Q&A: Cost Estimating and Cost Management Principles (Jan. 18, 2024). Accessed 2026-10-07.
- [17] International Code Council / Florida Building Commission. 2023 Florida Building Code, Building, 8th Edition, Chapter 2 Definitions. Accessed 2026-10-07.