
Highest paying cities for construction workers: the 2025 CB&C Real Construction Pay Index
- Primary data
- BLS OEWS May 2025 (MSA and national files); BEA Regional Price Parities by MSA 2024; Census Vintage 2025 CBSA population
- Data period
- May 2025 wages; 2024 price levels; July 1, 2025 population
- Latest release used
- 2026-05-15
- Next release
- BEA RPP 2025 on 2026-12-10; OEWS May 2026 date not yet announced in the sources checked
- Geography
- 56 US metropolitan statistical areas with population over 1 million
- Sources
- 20 (19 Tier 1)
The highest paying cities for construction workers in May 2025 were San Jose, San Francisco and Seattle in nominal terms. After adjusting for 2024 local price levels, San Jose (130.6, US = 100), Chicago (122.2) and San Francisco (121.4) lead 56 large metros. Miami ranks last at 79.1 after ranking 38th before adjustment.
How the index is built
CB&C Real Construction Pay Index 2025
FormulaReal = 100 x [sum(w_i x metro mean_i) / sum(w_i x US mean_i)] / (RPP / 100); w_i = US employment share of occupation i within the basket
Inputs: fact sheet nat_emp_*, nat_mean_*, mean_*_{metro}, rpp_{metro} rows; derived_metrics.csv w_*, us_basket_mean, {metro}-nom, {metro}-real (fact sheet rows)
Result: San Jose 130.6, Chicago 122.2, San Francisco 121.4, Seattle 121.2, Portland 121.2; Miami last at 79.1
Construction pay after prices is highest on the West Coast and in Midwestern metros with strong laborer and trades pay and moderate prices.
Limitations: Wages only (no benefits or overtime); RPP is 2024 and wages are May 2025; RPP measures consumer prices, not construction costs.
Nominal vs real rank shift
FormulaShift = nominal rank minus real rank (positive = moves up); Spearman rho of the two rankings
Inputs: derived_metrics.csv {metro}-rank-nom, {metro}-rank-real, {metro}-shift, rho (fact sheet rows)
Result: Rho 0.90; 10 metros move 10 or more places; Miami falls 18, Los Angeles 16, San Diego 15; Oklahoma City and Tulsa rise 14
Price levels matter most for metros with mid-table nominal pay; the top three hardly move.
Limitations: RPP covers all consumer spending; workers' own spending patterns may differ.
Electrician to laborer pay ratio by metro
FormulaRatio = electricians annual mean (47-2111) / construction laborers annual mean (47-2061)
Inputs: fact sheet mean_47-2111_{metro}, mean_47-2061_{metro}; derived_metrics.csv {metro}-el-lab, us_el_lab (fact sheet rows)
Result: US 1.37; lowest Columbus 1.11 and St. Louis 1.14; highest Portland 1.77 and Washington, DC 1.60
Where laborers are paid close to skilled trades, the within-metro pay spread is small.
Limitations: Means can be pulled by a small number of high earners; occupation mix within SOC codes differs by metro.
Construction manager premium over construction laborers
FormulaRatio = construction managers mean (11-9021) / construction laborers mean (47-2061); premium = difference in dollars
Inputs: fact sheet mean_11-9021_{metro}, mean_47-2061_{metro}; derived_metrics.csv {metro}-cm-lab, {metro}-cm-prem, ladder_corr (fact sheet rows)
Result: US 2.39 and $72,330; Chicago 1.74 ($51,350); Miami 3.01 ($92,830); correlation with laborer real pay -0.88
The steepest pay ladders are in Sun Belt metros where laborer pay is low, not where manager pay is unusually high.
Limitations: Miami and Salt Lake City construction manager employment is not released, though wages are.
Mean vs median sensitivity
FormulaRepeat d1 with annual median wages; Spearman rho of the two real rankings
Inputs: fact sheet med_*_{metro}, nat_med_*; derived_metrics.csv {metro}-real-med, {metro}-rank-real-med, rho_med (fact sheet rows)
Result: Rho 0.98; same top three; largest shifts Philadelphia (14th to 21st), Fresno (19th to 26th), Detroit (26th to 17th)
The ranking does not depend on the choice of mean or median.
Limitations: A weighted sum of occupation medians is not the median of the combined basket.
How the CB&C Real Construction Pay Index is built
The index compares what large metros pay a fixed basket of seven construction occupations, then divides by local price levels. A fixed basket stops a metro from looking well paid simply because it employs more managers or electricians.
CB&C Real Construction Pay Index: Real index = 100 x [sum of (w x metro annual mean wage) / sum of (w x US annual mean wage)] / (metro RPP / 100), where w is each occupation's share of the seven occupations' US employment in May 2025. The US scores 100. A score above 100 means the metro pays its construction basket more than the US average once local prices are counted; below 100, less.
Regional Price Parity (RPP): BEA's measure of the price level of consumer goods and services, including housing rents, in an area relative to the US (US = 100) for one year. BEA states that housing rents are often the main driver of RPP differences (BEA, 2024 release).
| SOC code | Occupation | US employment, May 2025 | Weight (%) | US mean wage | US median wage |
|---|---|---|---|---|---|
| 11-9021 | Construction managers | 380,360 | 8.2 | $124,360 | $114,990 |
| 47-1011 | First-line supervisors | 812,210 | 17.4 | $86,450 | $79,920 |
| 47-2031 | Carpenters | 670,090 | 14.4 | $65,630 | $60,580 |
| 47-2111 | Electricians | 757,220 | 16.2 | $71,490 | $63,190 |
| 47-2152 | Plumbers and pipefitters | 465,840 | 10.0 | $72,170 | $63,800 |
| 47-2061 | Construction laborers | 1,096,780 | 23.5 | $52,030 | $47,120 |
| 47-2073 | Operating engineers | 478,090 | 10.3 | $66,290 | $59,850 |
| Basket | Employment-weighted basket | 4,660,590 | 100.0 | $72,524 | $65,894 |
Weights are each occupation's share of the seven occupations' combined US employment of 4,660,590 in May 2025. Mean and median are annual wages for wage and salary workers.
Source: [2] U.S. Bureau of Labor Statistics
The basket: construction managers (SOC 11-9021), first-line supervisors of construction trades and extraction workers (47-1011), carpenters (47-2031), electricians (47-2111), plumbers, pipefitters and steamfitters (47-2152), construction laborers (47-2061) and operating engineers and other construction equipment operators (47-2073). Laborers carry the largest weight (23.5%) and construction managers the smallest (8.2%), following US employment of 1,096,780 and 380,360 in May 2025 (BLS OEWS national file). The weighted US basket wage is $72,524 using means and $65,894 using medians.
Metro rule: every metropolitan statistical area with a July 1, 2025 population above 1,000,000 in the Census Vintage 2025 estimates, which gives 56 metros with 195,021,830 residents (Census Vintage 2025). Together they hold 3,541,640 construction and extraction jobs, 55.1% of the US total of 6,425,160 in May 2025. OEWS and BEA both use the OMB Bulletin 23-01 metro delineations, and all 56 Census Vintage 2025 area codes match both files one to one. All seven occupations have published mean and median wages in all 56 metros.
Why means: the mean is total wages divided by workers, so it moves with every worker's pay, while the median is the 50th percentile boundary (BLS OEWS FAQ). The sensitivity section repeats the index with medians.
Ranking: the highest paying cities for construction workers after local prices
San Jose leads both rankings. Chicago, St. Louis and Kansas City climb once prices are counted; Miami, Los Angeles and San Diego fall. 30 of the 56 large metros score above the US benchmark of 100 on the real index.
Seven-occupation construction basket, mean wages adjusted for 2024 local prices, US = 100
Source: CB&C analysis of BLS OEWS May 2025 (released 2026-05-15) and BEA Regional Price Parities 2024 (released 2026-02-19); large metros from Census Vintage 2025
San Jose-Sunnyvale-Santa Clara, CA has a basket mean wage of $104,550 in May 2025, a nominal index of 144.2 and an RPP of 110.4, for a real index of 130.6. Chicago-Naperville-Elgin, IL-IN is second at 122.2: its nominal index of 126.6 is sixth, but its 2024 RPP of 103.6 is lower than any metro ranked above it in nominal pay.
The real top 10 in 2025: San Jose 130.6, Chicago 122.2, San Francisco 121.4, Seattle 121.2, Portland 121.2, St. Louis 117.1, Boston 115.9, New York 114.4, Kansas City 114.0 and Minneapolis-St. Paul 113.7. Six are on the West Coast or in the Northeast and four are in the Midwest.
Lowest real construction pay among 56 metros with more than 1 million residents, US = 100
Source: CB&C analysis of BLS OEWS May 2025 (released 2026-05-15) and BEA Regional Price Parities 2024 (released 2026-02-19); large metros from Census Vintage 2025
The bottom 10 are all in the South or Southwest: Miami 79.1, Dallas-Fort Worth 82.9, Orlando 83.6, San Antonio 85.8, Tampa 86.0, Jacksonville 87.0, Tucson 88.1, Virginia Beach 88.5, Houston 88.6 and Atlanta 88.6. The highest real index (San Jose) is 1.65 times the lowest (Miami). State-level construction wages from QCEW are covered in the commercial builders by state report and are not repeated here.
Show all 56 rows
| Real rank | Metro area (MSA) | Population, July 2025 | Basket mean wage | Nominal index | RPP 2024 | Real index | Nominal rank | Rank change | Real rank (medians) |
|---|---|---|---|---|---|---|---|---|---|
| 1 | San Jose-Sunnyvale-Santa Clara, CA | 1,984,473 | $104,550 | 144.2 | 110.4 | 130.6 | 1 | 0 | 1 |
| 2 | Chicago-Naperville-Elgin, IL-IN | 9,434,123 | $91,810 | 126.6 | 103.6 | 122.2 | 6 | +4 | 2 |
| 3 | San Francisco-Oakland-Fremont, CA | 4,630,041 | $101,830 | 140.4 | 115.6 | 121.4 | 2 | -1 | 3 |
| 4 | Seattle-Tacoma-Bellevue, WA | 4,161,883 | $97,668 | 134.7 | 111.1 | 121.2 | 3 | -1 | 5 |
| 5 | Portland-Vancouver-Hillsboro, OR-WA | 2,542,282 | $92,635 | 127.7 | 105.4 | 121.2 | 5 | 0 | 4 |
| 6 | St. Louis, MO-IL | 2,814,421 | $80,721 | 111.3 | 95.1 | 117.1 | 14 | +8 | 6 |
| 7 | Boston-Cambridge-Newton, MA-NH | 5,034,221 | $91,030 | 125.5 | 108.3 | 115.9 | 7 | 0 | 9 |
| 8 | New York-Newark-Jersey City, NY-NJ | 20,112,448 | $93,420 | 128.8 | 112.6 | 114.4 | 4 | -4 | 11 |
| 9 | Kansas City, MO-KS | 2,270,682 | $76,540 | 105.5 | 92.5 | 114.0 | 20 | +11 | 10 |
| 10 | Minneapolis-St. Paul-Bloomington, MN-WI | 3,790,295 | $86,403 | 119.1 | 104.8 | 113.7 | 9 | -1 | 7 |
| 11 | Milwaukee-Waukesha, WI | 1,575,010 | $79,033 | 109.0 | 96.9 | 112.4 | 18 | +7 | 8 |
| 12 | Buffalo-Cheektowaga, NY | 1,155,653 | $76,611 | 105.6 | 95.8 | 110.2 | 19 | +7 | 12 |
| 13 | Sacramento-Roseville-Folsom, CA | 2,477,274 | $84,753 | 116.9 | 106.7 | 109.6 | 11 | -2 | 14 |
| 14 | Philadelphia-Camden-Wilmington, PA-NJ-DE-MD | 6,329,118 | $81,057 | 111.8 | 102.6 | 109.0 | 13 | -1 | 21 |
| 15 | Rochester, NY | 1,056,149 | $76,380 | 105.3 | 97.0 | 108.5 | 21 | +6 | 19 |
| 16 | Pittsburgh, PA | 2,421,992 | $74,463 | 102.7 | 94.7 | 108.5 | 26 | +10 | 22 |
| 17 | Columbus, OH | 2,242,028 | $75,027 | 103.5 | 95.5 | 108.4 | 24 | +7 | 16 |
| 18 | Providence-Warwick, RI-MA | 1,708,161 | $79,606 | 109.8 | 101.8 | 107.9 | 16 | -2 | 13 |
| 19 | Fresno, CA | 1,203,383 | $79,675 | 109.9 | 102.2 | 107.5 | 15 | -4 | 26 |
| 20 | Indianapolis-Carmel-Greenwood, IN | 2,205,695 | $74,296 | 102.4 | 95.7 | 107.1 | 27 | +7 | 15 |
| 21 | Hartford-West Hartford-East Hartford, CT | 1,171,426 | $79,393 | 109.5 | 102.7 | 106.5 | 17 | -4 | 18 |
| 22 | Cleveland, OH | 2,165,775 | $72,441 | 99.9 | 93.9 | 106.3 | 29 | +7 | 20 |
| 23 | Riverside-San Bernardino-Ontario, CA | 4,769,007 | $81,794 | 112.8 | 106.4 | 106.0 | 12 | -11 | 27 |
| 24 | Los Angeles-Long Beach-Anaheim, CA | 12,844,441 | $86,419 | 119.2 | 113.6 | 104.9 | 8 | -16 | 23 |
| 25 | San Diego-Chula Vista-Carlsbad, CA | 3,282,248 | $84,940 | 117.1 | 111.9 | 104.7 | 10 | -15 | 24 |
| 26 | Detroit-Warren-Dearborn, MI | 4,390,913 | $75,858 | 104.6 | 100.3 | 104.3 | 22 | -4 | 17 |
| 27 | Las Vegas-Henderson-North Las Vegas, NV | 2,407,226 | $75,018 | 103.4 | 100.2 | 103.2 | 25 | -2 | 31 |
| 28 | Cincinnati, OH-KY-IN | 2,312,858 | $71,390 | 98.4 | 95.4 | 103.2 | 30 | +2 | 25 |
| 29 | Omaha, NE-IA | 1,009,836 | $67,148 | 92.6 | 91.9 | 100.7 | 36 | +7 | 29 |
| 30 | Louisville/Jefferson County, KY-IN | 1,402,509 | $67,683 | 93.3 | 93.1 | 100.3 | 35 | +5 | 28 |
| 31 | Grand Rapids-Wyoming-Kentwood, MI | 1,183,645 | $68,724 | 94.8 | 95.5 | 99.2 | 32 | +1 | 30 |
| 32 | Tulsa, OK | 1,069,273 | $63,201 | 87.1 | 89.2 | 97.7 | 46 | +14 | 33 |
| 33 | Nashville-Davidson–Murfreesboro–Franklin, TN | 2,197,416 | $67,108 | 92.5 | 96.3 | 96.0 | 37 | +4 | 32 |
| 34 | Denver-Aurora-Centennial, CO | 3,092,037 | $73,613 | 101.5 | 105.8 | 96.0 | 28 | -6 | 35 |
| 35 | Washington-Arlington-Alexandria, DC-VA-MD-WV | 6,465,724 | $75,659 | 104.3 | 108.9 | 95.8 | 23 | -12 | 36 |
| 36 | Memphis, TN-MS-AR | 1,341,412 | $63,785 | 87.9 | 92.2 | 95.4 | 42 | +6 | 34 |
| 37 | Oklahoma City, OK | 1,512,813 | $62,359 | 86.0 | 90.4 | 95.1 | 51 | +14 | 38 |
| 38 | Baltimore-Columbia-Towson, MD | 2,857,781 | $71,002 | 97.9 | 104.5 | 93.7 | 31 | -7 | 41 |
| 39 | Greenville-Anderson-Greer, SC | 1,014,101 | $63,113 | 87.0 | 93.3 | 93.3 | 47 | +8 | 39 |
| 40 | Salt Lake City-Murray, UT | 1,308,377 | $68,133 | 93.9 | 100.9 | 93.1 | 34 | -6 | 37 |
| 41 | Phoenix-Mesa-Chandler, AZ | 5,228,938 | $68,351 | 94.2 | 103.3 | 91.2 | 33 | -8 | 40 |
| 42 | Birmingham, AL | 1,197,766 | $60,073 | 82.8 | 91.6 | 90.4 | 55 | +13 | 42 |
| 43 | Richmond, VA | 1,389,338 | $63,902 | 88.1 | 97.9 | 90.0 | 40 | -3 | 44 |
| 44 | Charlotte-Concord-Gastonia, NC-SC | 2,938,830 | $63,386 | 87.4 | 97.3 | 89.8 | 43 | -1 | 45 |
| 45 | Raleigh-Cary, NC | 1,595,720 | $63,846 | 88.0 | 98.2 | 89.7 | 41 | -4 | 43 |
| 46 | Austin-Round Rock-San Marcos, TX | 2,620,945 | $63,271 | 87.2 | 98.1 | 89.0 | 45 | -1 | 47 |
| 47 | Atlanta-Sandy Springs-Roswell, GA | 6,482,182 | $64,280 | 88.6 | 100.1 | 88.6 | 39 | -8 | 49 |
| 48 | Houston-Pasadena-The Woodlands, TX | 7,904,627 | $63,345 | 87.3 | 98.6 | 88.6 | 44 | -4 | 52 |
| 49 | Virginia Beach-Chesapeake-Norfolk, VA-NC | 1,797,213 | $62,885 | 86.7 | 97.9 | 88.5 | 49 | 0 | 46 |
| 50 | Tucson, AZ | 1,074,685 | $61,922 | 85.4 | 96.9 | 88.1 | 53 | +3 | 48 |
| 51 | Jacksonville, FL | 1,785,500 | $62,749 | 86.5 | 99.5 | 87.0 | 50 | -1 | 50 |
| 52 | Tampa-St. Petersburg-Clearwater, FL | 3,418,895 | $62,956 | 86.8 | 100.9 | 86.0 | 48 | -4 | 53 |
| 53 | San Antonio-New Braunfels, TX | 2,813,140 | $58,970 | 81.3 | 94.7 | 85.8 | 56 | +3 | 51 |
| 54 | Orlando-Kissimmee-Sanford, FL | 2,957,672 | $61,489 | 84.8 | 101.4 | 83.6 | 54 | 0 | 55 |
| 55 | Dallas-Fort Worth-Arlington, TX | 8,477,157 | $62,001 | 85.5 | 103.1 | 82.9 | 52 | -3 | 54 |
| 56 | Miami-Fort Lauderdale-West Palm Beach, FL | 6,391,072 | $65,499 | 90.3 | 114.2 | 79.1 | 38 | -18 | 56 |
Nominal index: basket mean wage relative to the US basket ($72,524 = 100). Real index = nominal index / RPP x 100. Rank change: positive means the metro moves up once local prices are counted. Real rank (medians) repeats the index with median wages.
Source: [1][2][8][12] U.S. Bureau of Labor Statistics; U.S. Bureau of Labor Statistics; U.S. Bureau of Economic Analysis; U.S. Census Bureau
Sensitivity: nominal vs real ranks, mean vs median
The price adjustment reshuffles the middle and bottom of the table far more than the top. Using medians instead of means barely changes the order (rank correlation 0.98).
Construction pay index before and after the BEA price adjustment (US = 100); rank in brackets in table t3
Source: CB&C analysis of BLS OEWS May 2025 (released 2026-05-15) and BEA Regional Price Parities 2024 (released 2026-02-19); large metros from Census Vintage 2025
Nominal and real ranks agree closely at the extremes but not in between: the Spearman rank correlation is 0.90, and 10 of 56 metros move 10 or more places. Miami falls 18 places, from 38th to 56th, because its 2024 RPP of 114.2 is the second highest of the 56. Los Angeles falls 16 places (8th to 24th) and San Diego 15 places (10th to 25th).
The biggest gains go to lower-cost metros with mid-table pay: Oklahoma City and Tulsa each rise 14 places, Birmingham 13, Kansas City 11 (20th to 9th) and Pittsburgh 10. Tulsa has the lowest RPP of the 56 at 89.2.
| Metro area (MSA) | Nominal rank | Real rank | Rank change | RPP 2024 | Nominal index | Real index |
|---|---|---|---|---|---|---|
| Oklahoma City, OK | 51 | 37 | +14 | 90.4 | 86.0 | 95.1 |
| Tulsa, OK | 46 | 32 | +14 | 89.2 | 87.1 | 97.7 |
| Birmingham, AL | 55 | 42 | +13 | 91.6 | 82.8 | 90.4 |
| Kansas City, MO-KS | 20 | 9 | +11 | 92.5 | 105.5 | 114.0 |
| Pittsburgh, PA | 26 | 16 | +10 | 94.7 | 102.7 | 108.5 |
| St. Louis, MO-IL | 14 | 6 | +8 | 95.1 | 111.3 | 117.1 |
| Miami-Fort Lauderdale-West Palm Beach, FL | 38 | 56 | -18 | 114.2 | 90.3 | 79.1 |
| Los Angeles-Long Beach-Anaheim, CA | 8 | 24 | -16 | 113.6 | 119.2 | 104.9 |
| San Diego-Chula Vista-Carlsbad, CA | 10 | 25 | -15 | 111.9 | 117.1 | 104.7 |
| Washington-Arlington-Alexandria, DC-VA-MD-WV | 23 | 35 | -12 | 108.9 | 104.3 | 95.8 |
| Riverside-San Bernardino-Ontario, CA | 12 | 23 | -11 | 106.4 | 112.8 | 106.0 |
| Phoenix-Mesa-Chandler, AZ | 33 | 41 | -8 | 103.3 | 94.2 | 91.2 |
Six largest rises and six largest falls among 56 large metros. Ranks run from 1 (highest pay) to 56.
Source: [1][8] U.S. Bureau of Labor Statistics; U.S. Bureau of Economic Analysis
Median version: the top three (San Jose, Chicago, San Francisco) are unchanged. The largest shifts are Philadelphia (14th on means, 21st on medians), Fresno (19th to 26th) and Detroit (26th to 17th). A metro that drops on medians has a pay distribution pulled up by higher earners.
Composition check: dividing the median wage of the whole construction and extraction group (SOC 47-0000) by the RPP gives $81,307 for Chicago and $44,369 for Miami, the same values Construction Coverage publishes for its first and last large metros (Construction Coverage). The fixed basket used here differs from that method in two ways: it holds the occupation mix constant across metros, and it includes construction managers, who are outside SOC 47-0000.
Pay by trade: seven construction occupations across 56 metros
San Jose or San Francisco pays the highest nominal mean in all seven occupations. After prices, Chicago, Portland and St. Louis take the lead in three trades, and Miami is last in six of seven.
| SOC code | Occupation | US mean wage | US median wage | Highest nominal mean (large metro) | Highest price-adjusted mean | Lowest price-adjusted mean |
|---|---|---|---|---|---|---|
| 11-9021 | Construction managers | $124,360 | $114,990 | San Jose, CA ($168,220) | San Jose, CA ($152,341) | San Antonio, TX ($111,470) |
| 47-1011 | First-line supervisors | $86,450 | $79,920 | San Jose, CA ($130,350) | San Jose, CA ($118,046) | Miami, FL ($72,323) |
| 47-2031 | Carpenters | $65,630 | $60,580 | San Francisco, CA ($89,630) | Chicago, IL ($80,226) | Miami, FL ($47,330) |
| 47-2111 | Electricians | $71,490 | $63,190 | San Francisco, CA ($103,690) | Portland, OR ($97,732) | Miami, FL ($52,499) |
| 47-2152 | Plumbers and pipefitters | $72,170 | $63,800 | San Jose, CA ($114,280) | San Jose, CA ($103,493) | Miami, FL ($50,659) |
| 47-2061 | Construction laborers | $52,030 | $47,120 | San Francisco, CA ($73,640) | St. Louis, MO ($70,135) | Miami, FL ($40,401) |
| 47-2073 | Operating engineers | $66,290 | $59,850 | San Jose, CA ($111,400) | San Jose, CA ($100,885) | Miami, FL ($48,093) |
Price-adjusted mean = metro annual mean wage x 100 / metro RPP 2024, expressed at the US-average price level.
Source: [1][2][8] U.S. Bureau of Labor Statistics; U.S. Bureau of Labor Statistics; U.S. Bureau of Economic Analysis
Construction managers (11-9021). US mean $124,360, median $114,990 in May 2025. Highest nominal means: San Jose $168,220, San Francisco $164,760, Seattle $163,750, New York $162,800 and Boston $159,530. Price-adjusted, San Jose still leads at $152,341. Manager pay varies least across metros of the seven occupations: the highest price-adjusted mean is 1.37 times the lowest (San Antonio, $111,470).
First-line supervisors (47-1011). US mean $86,450. San Jose pays $130,350 nominal and $118,046 price-adjusted, ahead of Seattle ($109,472 adjusted) and Portland ($107,967). This SOC code also covers extraction supervisors such as rig supervisors (BLS SOC 2018), which matters in oil and gas metros.
Carpenters (47-2031). US mean $65,630. San Francisco has the highest nominal mean at $89,630, but Chicago leads after prices at $80,226, ahead of San Jose ($79,630).
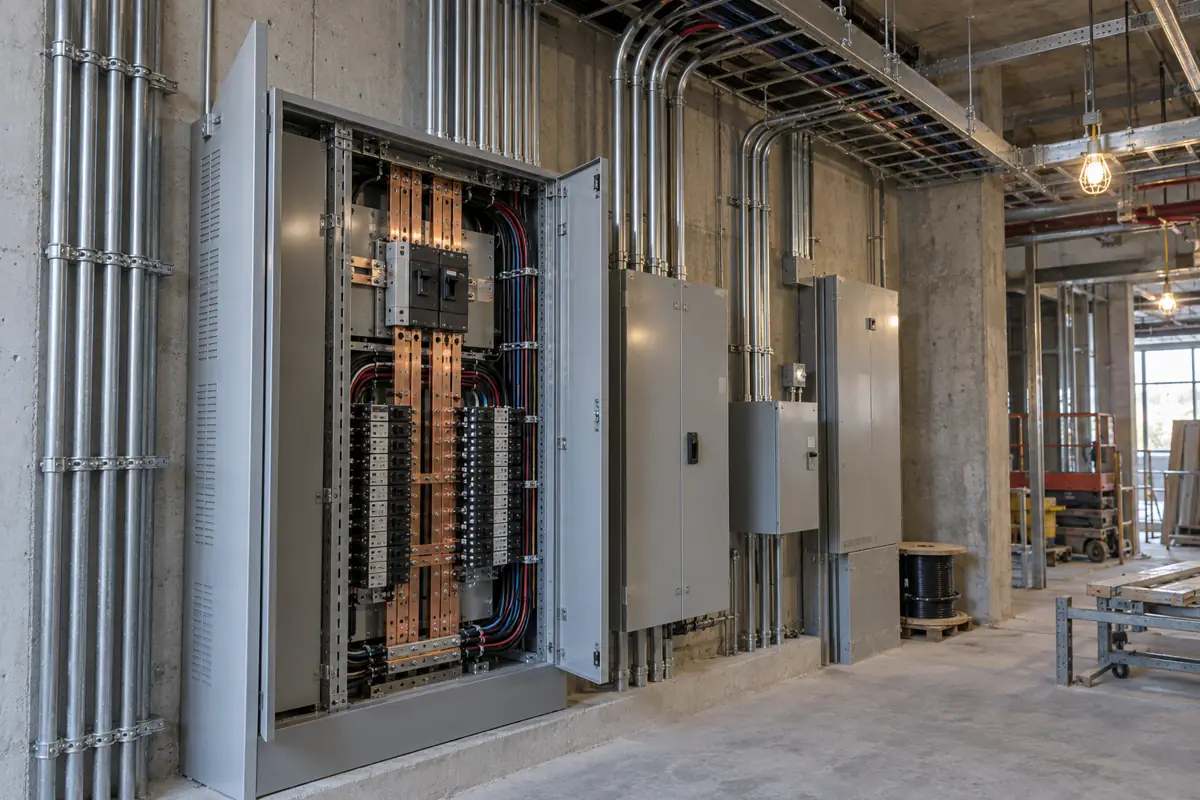
Electricians (47-2111). US mean $71,490 and median $63,190. San Francisco ($103,690) and Portland ($103,030) pay the most in nominal terms; Portland leads after prices at $97,732, then Chicago at $91,172. BLS projects electrician employment to grow 9% from 2025 to 2035, with about 72,700 openings a year, and notes that most states require electricians to be licensed (BLS Occupational Outlook Handbook).
Plumbers, pipefitters and steamfitters (47-2152). US mean $72,170. San Jose pays $114,280, the highest nominal and price-adjusted ($103,493) mean; Portland ($95,531 adjusted) and Chicago ($93,084) follow. The highest adjusted mean is 2.04 times the lowest.
Construction laborers (47-2061). US mean $52,030 and median $47,120. San Francisco pays the highest nominal mean ($73,640), but St. Louis leads after prices at $70,135, ahead of Chicago ($66,779), Boston ($65,902) and Columbus ($65,372). Miami is last after prices at $40,401.
Operating engineers and equipment operators (47-2073). US mean $66,290. San Jose ($111,400) and San Francisco ($110,300) lead in nominal terms and after prices ($100,885 and $95,404). This occupation has the widest metro spread of the seven: the highest adjusted mean is 2.10 times the lowest.
Annual mean wage, nominal, thousands of dollars
Source: BLS OEWS May 2025 metropolitan and national estimates (released 2026-05-15)
| Occupation | San Jose, CA | Chicago, IL | San Francisco, CA | Seattle, WA | Portland, OR | United States |
|---|---|---|---|---|---|---|
| Construction managers | $168,220 | $120,530 | $164,760 | $163,750 | $151,370 | $124,360 |
| First-line supervisors | $130,350 | $108,300 | $119,190 | $121,660 | $113,820 | $86,450 |
| Carpenters | $87,930 | $83,110 | $89,630 | $84,060 | $77,940 | $65,630 |
| Electricians | $99,650 | $94,450 | $103,690 | $99,720 | $103,030 | $71,490 |
| Plumbers and pipefitters | $114,280 | $96,430 | $92,380 | $96,250 | $100,710 | $72,170 |
| Construction laborers | $69,780 | $69,180 | $73,640 | $64,990 | $58,080 | $52,030 |
| Operating engineers | $111,400 | $96,370 | $110,300 | $96,510 | $85,450 | $66,290 |
Nominal annual mean wages (not price-adjusted). The five metros are the top five of the real index.
Source: [1][2] U.S. Bureau of Labor Statistics; U.S. Bureau of Labor Statistics
Trade pay spread and the construction manager premium by metro
The gap between the best and worst paid construction jobs in a metro is narrowest where laborers earn the most. Across 56 metros, laborer pay after prices and the manager to laborer ratio have a correlation of -0.88.
Electricians vs laborers: nationally, electricians earn 1.37 times the laborer mean in May 2025. The ratio is lowest in Columbus (1.11) and St. Louis (1.14), where laborer means are $62,410 and $66,690, and highest in Portland (1.77) and Washington, DC (1.60).
Construction managers vs laborers: nationally, managers earn 2.39 times the laborer mean, a premium of $72,330. Chicago has the flattest ladder (1.74, premium $51,350) and Miami the steepest (3.01, premium $92,830), followed by Atlanta (2.95) and Richmond (2.93). 27 of the 56 metros sit below the US ratio.
10 lowest and 10 highest ratios among 56 large metros; US ratio is 2.39
Source: CB&C analysis of BLS OEWS May 2025 metropolitan estimates
Reading the pattern: in the five top real-pay metros the manager to laborer ratio runs from 1.74 (Chicago) to 2.61 (Portland), around the US 2.39. What separates them from the bottom of the table is laborer and trades pay. That links this ranking to hiring conditions covered in the CB&C construction labor shortage report; demographic pay gaps are covered separately in women in construction.
Show all 57 rows
| Metro area (MSA) | Laborers mean | Laborers median | Electricians mean | Construction managers mean | Electrician to laborer ratio | Manager to laborer ratio | Manager premium over laborers |
|---|---|---|---|---|---|---|---|
| Chicago-Naperville-Elgin, IL-IN | $69,180 | $60,890 | $94,450 | $120,530 | 1.37 | 1.74 | $51,350 |
| St. Louis, MO-IL | $66,690 | $64,500 | $75,770 | $120,210 | 1.14 | 1.80 | $53,520 |
| Cleveland, OH | $57,910 | $57,180 | $71,210 | $107,640 | 1.23 | 1.86 | $49,730 |
| Columbus, OH | $62,410 | $60,540 | $69,240 | $116,170 | 1.11 | 1.86 | $53,760 |
| Cincinnati, OH-KY-IN | $57,840 | $54,930 | $66,830 | $112,790 | 1.16 | 1.95 | $54,950 |
| Minneapolis-St. Paul-Bloomington, MN-WI | $67,800 | $61,970 | $83,850 | $134,250 | 1.24 | 1.98 | $66,450 |
| Riverside-San Bernardino-Ontario, CA | $65,580 | $59,500 | $80,090 | $130,720 | 1.22 | 1.99 | $65,140 |
| Providence-Warwick, RI-MA | $62,920 | $59,280 | $73,080 | $126,890 | 1.16 | 2.02 | $63,970 |
| Fresno, CA | $60,040 | $55,120 | $76,150 | $122,190 | 1.27 | 2.04 | $62,150 |
| Milwaukee-Waukesha, WI | $59,610 | $57,430 | $75,670 | $123,070 | 1.27 | 2.06 | $63,460 |
| Sacramento-Roseville-Folsom, CA | $64,070 | $60,560 | $79,870 | $134,220 | 1.25 | 2.09 | $70,150 |
| Detroit-Warren-Dearborn, MI | $55,960 | $57,430 | $79,240 | $121,130 | 1.42 | 2.16 | $65,170 |
| Grand Rapids-Wyoming-Kentwood, MI | $51,510 | $47,780 | $66,260 | $111,900 | 1.29 | 2.17 | $60,390 |
| Indianapolis-Carmel-Greenwood, IN | $54,420 | $51,040 | $69,210 | $118,250 | 1.27 | 2.17 | $63,830 |
| Pittsburgh, PA | $54,280 | $50,600 | $75,340 | $119,440 | 1.39 | 2.20 | $65,160 |
| Los Angeles-Long Beach-Anaheim, CA | $63,220 | $58,810 | $82,300 | $139,240 | 1.30 | 2.20 | $76,020 |
| Kansas City, MO-KS | $56,460 | $50,500 | $77,660 | $125,940 | 1.38 | 2.23 | $69,480 |
| Boston-Cambridge-Newton, MA-NH | $71,350 | $63,420 | $83,370 | $159,530 | 1.17 | 2.24 | $88,180 |
| San Francisco-Oakland-Fremont, CA | $73,640 | $72,610 | $103,690 | $164,760 | 1.41 | 2.24 | $91,120 |
| Hartford-West Hartford-East Hartford, CT | $58,880 | $56,280 | $75,810 | $132,740 | 1.29 | 2.25 | $73,860 |
| Buffalo-Cheektowaga, NY | $57,970 | $50,620 | $75,440 | $130,690 | 1.30 | 2.25 | $72,720 |
| Omaha, NE-IA | $49,570 | $48,300 | $66,780 | $112,090 | 1.35 | 2.26 | $62,520 |
| San Diego-Chula Vista-Carlsbad, CA | $60,490 | $57,180 | $82,240 | $138,000 | 1.36 | 2.28 | $77,510 |
| Philadelphia-Camden-Wilmington, PA-NJ-DE-MD | $58,940 | $55,120 | $81,720 | $135,120 | 1.39 | 2.29 | $76,180 |
| Las Vegas-Henderson-North Las Vegas, NV | $53,090 | $48,230 | $75,210 | $123,920 | 1.42 | 2.33 | $70,830 |
| Louisville/Jefferson County, KY-IN | $49,750 | $47,420 | $64,780 | $116,840 | 1.30 | 2.35 | $67,090 |
| Salt Lake City-Murray, UT | $50,160 | $47,460 | $66,610 | $118,170 | 1.33 | 2.36 | $68,010 |
| San Jose-Sunnyvale-Santa Clara, CA | $69,780 | $68,470 | $99,650 | $168,220 | 1.43 | 2.41 | $98,440 |
| New York-Newark-Jersey City, NY-NJ | $67,440 | $61,270 | $88,670 | $162,800 | 1.31 | 2.41 | $95,360 |
| Tucson, AZ | $45,180 | $45,060 | $61,560 | $110,120 | 1.36 | 2.44 | $64,940 |
| Memphis, TN-MS-AR | $47,210 | $44,810 | $62,690 | $117,380 | 1.33 | 2.49 | $70,170 |
| Phoenix-Mesa-Chandler, AZ | $48,670 | $46,910 | $64,380 | $122,350 | 1.32 | 2.51 | $73,680 |
| Seattle-Tacoma-Bellevue, WA | $64,990 | $59,740 | $99,720 | $163,750 | 1.53 | 2.52 | $98,760 |
| San Antonio-New Braunfels, TX | $41,880 | $39,390 | $57,030 | $105,580 | 1.36 | 2.52 | $63,700 |
| Rochester, NY | $55,470 | $49,290 | $76,630 | $142,690 | 1.38 | 2.57 | $87,220 |
| Charlotte-Concord-Gastonia, NC-SC | $46,150 | $45,850 | $59,100 | $119,710 | 1.28 | 2.59 | $73,560 |
| Portland-Vancouver-Hillsboro, OR-WA | $58,080 | $54,240 | $103,030 | $151,370 | 1.77 | 2.61 | $93,290 |
| Austin-Round Rock-San Marcos, TX | $44,360 | $44,000 | $60,850 | $116,740 | 1.37 | 2.63 | $72,380 |
| Dallas-Fort Worth-Arlington, TX | $43,780 | $43,960 | $59,960 | $115,370 | 1.37 | 2.64 | $71,590 |
| Oklahoma City, OK | $43,420 | $39,430 | $62,550 | $114,690 | 1.44 | 2.64 | $71,270 |
| Denver-Aurora-Centennial, CO | $50,940 | $48,760 | $67,590 | $134,570 | 1.33 | 2.64 | $83,630 |
| Greenville-Anderson-Greer, SC | $45,970 | $44,380 | $61,220 | $122,460 | 1.33 | 2.66 | $76,490 |
| Birmingham, AL | $40,420 | $38,370 | $57,450 | $108,260 | 1.42 | 2.68 | $67,840 |
| Houston-Pasadena-The Woodlands, TX | $43,850 | $41,350 | $61,470 | $117,600 | 1.40 | 2.68 | $73,750 |
| Tulsa, OK | $45,200 | $43,200 | $65,510 | $121,990 | 1.45 | 2.70 | $76,790 |
| Raleigh-Cary, NC | $46,490 | $45,650 | $57,080 | $127,320 | 1.23 | 2.74 | $80,830 |
| Nashville-Davidson–Murfreesboro–Franklin, TN | $46,700 | $46,190 | $66,710 | $130,470 | 1.43 | 2.79 | $83,770 |
| Washington-Arlington-Alexandria, DC-VA-MD-WV | $49,670 | $47,430 | $79,650 | $139,680 | 1.60 | 2.81 | $90,010 |
| Baltimore-Columbia-Towson, MD | $47,640 | $46,460 | $72,790 | $135,840 | 1.53 | 2.85 | $88,200 |
| Tampa-St. Petersburg-Clearwater, FL | $44,520 | $43,750 | $58,020 | $127,650 | 1.30 | 2.87 | $83,130 |
| Jacksonville, FL | $43,790 | $43,480 | $57,840 | $125,720 | 1.32 | 2.87 | $81,930 |
| Orlando-Kissimmee-Sanford, FL | $43,130 | $40,880 | $55,310 | $125,240 | 1.28 | 2.90 | $82,110 |
| Virginia Beach-Chesapeake-Norfolk, VA-NC | $40,870 | $38,490 | $63,030 | $119,140 | 1.54 | 2.92 | $78,270 |
| Richmond, VA | $42,970 | $42,410 | $62,360 | $126,100 | 1.45 | 2.93 | $83,130 |
| Atlanta-Sandy Springs-Roswell, GA | $43,150 | $42,010 | $62,020 | $127,350 | 1.44 | 2.95 | $84,200 |
| Miami-Fort Lauderdale-West Palm Beach, FL | $46,120 | $45,520 | $59,930 | $138,950 | 1.30 | 3.01 | $92,830 |
| United States | $52,030 | $47,120 | $71,490 | $124,360 | 1.37 | 2.39 | $72,330 |
Ratios use annual mean wages. Premium = construction managers mean minus construction laborers mean, in current dollars.
Source: [1][2] U.S. Bureau of Labor Statistics; U.S. Bureau of Labor Statistics
What the index cannot tell you
The index measures straight-time wages for employees against consumer prices. It leaves out benefits, overtime, the self-employed and union status, and it mixes a 2024 price year with May 2025 wages.
- Benefits are excluded. In June 2026, benefits were 31.0% of employer compensation costs ($14.47 of $46.65 per hour) for private construction, extraction, farming, fishing and forestry occupations (BLS ECEC). Metros where benefit packages are richer will look worse on a wages-only index than on total compensation.
- Overtime, shift differentials and nonproduction bonuses are excluded from OEWS wages, and the survey does not cover the self-employed (BLS OEWS technical note).
- Union status is not visible. In 2025, 16.4% of construction and extraction workers were union members against 10.0% of all wage and salary workers (BLS), and full-time union members in these occupations had median weekly earnings of $1,561 against $1,004 for nonunion workers (BLS), a ratio of 1.55. Union density by metro is not published in OEWS.
- Timing: RPPs are for 2024 (released 2026-02-19); OEWS May 2025 wages pool six survey panels from November 2022 to May 2025. The 2025 RPPs are scheduled for 2026-12-10.
- RPPs measure consumer prices, not construction costs or tax burdens. A metro with a high RPP can still have high construction demand.
- Metro averages hide county variation, and some estimates are less precise: the construction manager mean for Hartford carries a relative standard error of 15.5%, the highest in the basket.
- OEWS is designed for cross-section comparisons; the three-year panel design makes it a weak tool for year-to-year change.
Key findings
- San Jose-Sunnyvale-Santa Clara, CA has the highest CB&C Real Construction Pay Index of 56 large US metros in 2025: 130.6 (US = 100), from a basket mean wage of $104,550 and an RPP of 110.4.[1][8]
- Chicago-Naperville-Elgin, IL-IN ranks second on the real index at 122.2 in 2025, up from sixth on nominal pay (126.6).[1][8]
- San Francisco (121.4), Seattle (121.2) and Portland (121.2) complete the real top five for 2025.[1][8]
- St. Louis rises from 14th to 6th (117.1) and Kansas City from 20th to 9th (114.0) once 2024 local prices are counted.[1][8]
- Miami-Fort Lauderdale-West Palm Beach ranks 56th of 56 at 79.1 in 2025, down from 38th on nominal pay, the largest fall in the index.[1][8]
- Los Angeles falls 16 places (8th to 24th) and San Diego 15 places (10th to 25th) after the price adjustment.[1][8]
- 30 of the 56 large metros score above 100 on the real index in 2025; 28 score above 100 on nominal pay.[1][8]
- The 10 lowest real index metros in 2025 are all in Florida, Texas, Georgia, Arizona or Virginia, led from the bottom by Miami, Dallas-Fort Worth (82.9) and Orlando (83.6).[1][8]
- US construction managers earned a mean of $124,360 in May 2025, 2.39 times the $52,030 mean for construction laborers.[2]
- Chicago has the flattest construction pay ladder of the 56 metros in May 2025 (manager to laborer ratio 1.74); Miami has the steepest (3.01).[1]
- Across the 56 metros, laborer pay after prices and the manager to laborer ratio have a correlation of -0.88: where laborers earn more, the ladder is flatter.[1][8]
- Portland pays electricians the most after prices in May 2025 ($97,732 at US-average prices; $103,030 nominal mean).[1][8]
- St. Louis pays construction laborers the most after prices in May 2025 ($70,135 at US-average prices; $66,690 nominal mean).[1][8]
- The 56 large metros hold 3,541,640 construction and extraction jobs in May 2025, 55.1% of the US total.[1][2]
Summary for decision makers
- San Jose has the highest real construction pay index of the 56 US metros with more than 1 million residents in 2025 (130.6, US = 100), ranking first before and after the price adjustment.
- Chicago is second at 122.2 after ranking sixth on nominal pay; St. Louis (117.1) and Kansas City (114.0) both enter the real top 10.
- Miami-Fort Lauderdale-West Palm Beach ranks last at 79.1 because its 2024 price level (RPP 114.2) is the second highest of the 56 while its basket wage is below the US average.
- The price adjustment moves 10 of the 56 metros by 10 or more places; Los Angeles drops from 8th to 24th and Oklahoma City rises from 51st to 37th.
- The ranking is stable to the choice of statistic: means and medians give a rank correlation of 0.98 and the same top three.
- Laborer pay drives the ranking: St. Louis pays laborers the most after prices ($70,135) and the manager to laborer ratio is flattest in Chicago (1.74).
- Miami ranks last after prices in six of the seven occupations, including construction laborers ($46,120 nominal mean, $40,401 price-adjusted).
Questions people ask
Which city pays construction workers the most?
Among the 56 US metros with more than 1 million residents, San Jose-Sunnyvale-Santa Clara, CA pays the seven-occupation construction basket the most in May 2025: a basket mean wage of $104,550 and a real index of 130.6 (US = 100) after adjusting for its 2024 RPP of 110.4. It ranks first before and after the price adjustment.
Where do electricians make the most money?
San Francisco has the highest electrician annual mean wage of the 56 large metros in May 2025 at $103,690, just ahead of Portland at $103,030. After adjusting for 2024 prices, Portland leads at $97,732, followed by Chicago at $91,172. The US mean is $71,490.
How much do construction managers make by city?
Construction managers earned a US mean of $124,360 in May 2025. The highest large-metro means are San Jose $168,220, San Francisco $164,760, Seattle $163,750, New York $162,800 and Boston $159,530; the lowest is San Antonio at $105,580. Table t5 lists all 56 metros.
What is the best city for construction jobs after cost of living?
On pay alone, San Jose (130.6), Chicago (122.2) and San Francisco (121.4) lead the 2025 real index. For lower-cost metros, St. Louis (117.1, RPP 95.1) and Kansas City (114.0, RPP 92.5) rank in the top 10. The index does not measure job openings, benefits or housing availability.
How much do construction laborers make in Miami?
In the Miami-Fort Lauderdale-West Palm Beach MSA, construction laborers had an annual mean wage of $46,120 and a median of $45,520 in May 2025, with employment of 18,280. At US-average prices the mean equals $40,401, the lowest of the 56 large metros. See the South Florida commercial construction report.
For journalists and researchers
If you cite only a few, cite these
- San Jose 130.6, Chicago 122.2 and San Francisco 121.4 lead the 2025 CB&C Real Construction Pay Index of 56 large US metros (US = 100).[1][8]
- Miami falls 18 places, from 38th to 56th, when construction pay is adjusted for 2024 local prices.[1][8]
- Across 56 large metros in May 2025, laborer pay after prices and the manager to laborer pay ratio have a correlation of -0.88.[1][8]
Most quotable statistics
- San Jose has the highest real construction pay of 56 large US metros in 2025: an index of 130.6, where the US is 100.[1][8]
- Chicago ranks second for construction pay after local prices in 2025 (122.2), up from sixth on nominal pay.[1][8]
- Miami-Fort Lauderdale-West Palm Beach ranks last of 56 large metros for real construction pay in 2025 (79.1), after ranking 38th before prices.[1][8]
- Ten of the 56 largest US metros move 10 or more places in the construction pay ranking once 2024 local prices are counted.[1][8]
- US construction managers earned 2.39 times the construction laborer mean wage in May 2025; in Chicago the ratio was 1.74, in Miami 3.01.[1][2]
- St. Louis pays construction laborers the most of any large US metro after prices: $70,135 at US-average prices in May 2025.[1][8]
Press summary
San Jose pays construction workers the most of any large US metro once local prices are counted, according to the 2025 CB&C Real Construction Pay Index from Commercial Builders & Contractors. The index weights BLS May 2025 wages for seven construction occupations by national employment and divides by BEA 2024 Regional Price Parities for the 56 metros with more than 1 million residents. San Jose scores 130.6 (US = 100), followed by Chicago at 122.2 and San Francisco at 121.4. Chicago, St. Louis and Kansas City climb the table after the price adjustment; Miami falls from 38th to 56th and Los Angeles from 8th to 24th. The analysis also finds that pay ladders are flattest where laborers earn the most: Chicago construction managers earn 1.74 times the laborer mean, against 3.01 in Miami. Data and calculations are published as CSV files under CC BY 4.0.
Suggested headlines
- San Jose tops 2025 ranking of construction pay after local prices
- Chicago is the second-best large metro for construction pay once prices are counted
- Miami drops to last of 56 metros for real construction pay
- Price adjustment moves 10 large metros 10 or more places in construction pay ranking
- Construction managers earn 2.39 times laborer pay nationally; the gap is widest in Miami
How to cite this report
Commercial Builders & Contractors. (2026). Highest paying cities for construction workers: the 2025 CB&C Real Construction Pay Index. Retrieved from https://commercialbuildersandcontractors.com/construction-pay-by-metro/
Reuse license
Data and tables are licensed CC BY 4.0. Attribution: “Source: Commercial Builders & Contractors, Highest paying cities for construction workers: the 2025 CB&C Real Construction Pay Index” with a link to this page.
Download the data
Every table in this report is available as a CSV under CC BY 4.0. The fact sheet lists each value with its source URL and access date.
- derived_metrics.csv (CSV)
- fact_sheet.csv (CSV)
- The CB&C construction pay basket: seven occupations weighted by US employment, May 2025 (CSV)
- CB&C Real Construction Pay Index 2025: all 56 US metros with more than 1 million residents (CSV)
- Biggest movers: metros whose rank changes most after the price adjustment (CSV)
- Occupation deep-dive: national pay and the highest and lowest paying large metros for each trade, May 2025 (CSV)
- Trade pay spread and construction manager premium in 56 large metros, May 2025 (sorted by manager to laborer ratio) (CSV)
- Annual mean wage by occupation in the five metros with the highest real index, May 2025 (CSV)
Frequently asked questions
What are the highest paying cities for construction workers in 2025?
After adjusting for 2024 local prices, San Jose (130.6), Chicago (122.2), San Francisco (121.4), Seattle (121.2) and Portland (121.2) lead 56 large US metros on the CB&C Real Construction Pay Index, based on BLS May 2025 wages.
Which large metro pays construction workers the least after cost of living?
Miami-Fort Lauderdale-West Palm Beach ranks 56th of 56 at 79.1 (US = 100) in 2025, followed by Dallas-Fort Worth (82.9) and Orlando (83.6).
What occupations are in the construction pay basket?
Seven: construction managers, first-line supervisors, carpenters, electricians, plumbers and pipefitters, construction laborers and operating engineers, weighted by US employment in May 2025 (laborers 23.5%, managers 8.2%).
What is the average construction laborer wage in the US?
The US annual mean wage for construction laborers was $52,030 in May 2025 and the median was $47,120, according to BLS OEWS.
What is the US mean wage for construction and extraction occupations?
BLS reports an annual mean wage of $65,360 for all construction and extraction occupations in May 2025, below the $69,770 mean for all occupations.
Which city pays construction laborers the most after cost of living?
St. Louis: its May 2025 laborer mean of $66,690 equals $70,135 at US-average prices, the highest of the 56 large metros. San Francisco has the highest nominal laborer mean at $73,640.
How much more do construction managers earn than laborers?
Nationally, construction managers earned $72,330 more than construction laborers in May 2025 (means of $124,360 and $52,030), a ratio of 2.39.
Why does Miami rank so low?
Miami's 2024 RPP of 114.2 is the second highest of the 56 large metros, while its construction basket wage ($65,499) is below the US basket ($72,524). The price adjustment moves it from 38th to 56th.
Do these wages include overtime and benefits?
No. OEWS wages are straight-time pay. Benefits were 31.0% of employer compensation costs for private construction, extraction, farming, fishing and forestry occupations in June 2026 (BLS ECEC).
How often is the index updated?
When BLS releases new OEWS wages (May 2025 data came out on 2026-05-15) or BEA releases new RPPs (2025 RPPs are scheduled for 2026-12-10).
Methodology
Source selection: wages come from the BLS Occupational Employment and Wage Statistics (OEWS) May 2025 metropolitan and national files released on 2026-05-15, the latest release on the OEWS tables page when checked on 2026-10-05. Price levels are BEA all-items Regional Price Parities by MSA for 2024, released on 2026-02-19 (MARPP.zip, the latest year available). Population is the Census Vintage 2025 CBSA file (July 1, 2025 estimates). OEWS and BEA use OMB Bulletin 23-01 delineations, and the 56 Census area codes match both files one to one. Raw files are kept unmodified in the report's raw folder.
Inclusion and exclusion: metropolitan statistical areas (not micropolitan areas, not metropolitan divisions) with a July 1, 2025 population above 1,000,000, giving 56 metros. OEWS cross-industry, cross-ownership estimates are used. All seven basket occupations have published annual mean and median wages in all 56 metros, so no imputation was needed.
Index construction: weights are each occupation's share of the basket's US employment in May 2025. The nominal index is the weighted metro wage divided by the weighted US wage, times 100. The real index divides the nominal index by the metro RPP and multiplies by 100. Ranks run from 1 (highest) to 56. The median version repeats the calculation with annual median wages.
Derived metrics: electrician to laborer ratio, manager to laborer ratio and dollar premium use annual means. Occupation wages at US-average prices equal the metro mean x 100 / RPP. Rank correlations are Spearman; the ladder correlation is Pearson. Every derived value is in derived_metrics.csv with its formula and fact sheet rows; scripts/build_index.py and scripts/compute_outputs.py reproduce them.
Conflicting numbers: the OEWS national file and the OEWS news release agree (for example, construction and extraction mean $65,360). A replication of the SOC 47-0000 median method used by Construction Coverage reproduces its published Chicago ($81,307) and Miami ($44,369) values, which confirms the shared inputs. Differences between the two rankings come from basket design, not data.
Limitations: OEWS wages exclude benefits, overtime and the self-employed; RPPs are consumer price levels for 2024 while wages refer to May 2025; SOC 47-1011 includes extraction supervisors; some metro estimates have relative standard errors above 5%; Miami and Salt Lake City construction manager employment is not released. Not financial, career or legal advice.
Last updated 2026-10-05. Next scheduled input: BEA 2025 RPPs on 2026-12-10. The index will be rerun when OEWS May 2026 estimates are released.
This report presents published data with its limitations. It is not legal, financial or investment advice.
Sources, ranked by quality
Tier 1: primary and official sources (19)
- [1] U.S. Bureau of Labor Statistics. OEWS May 2025 metropolitan and nonmetropolitan area estimates, MSA file (oesm25ma.zip, MSA_M2025_dl.xlsx). May 2025 (six panels, November 2022 to May 2025). Accessed 2026-10-05.
- [2] U.S. Bureau of Labor Statistics. OEWS May 2025 national estimates (oesm25nat.zip, national_M2025_dl.xlsx). May 2025. Accessed 2026-10-05.
- [3] U.S. Bureau of Labor Statistics. Occupational Employment and Wage Statistics (OEWS) Tables (release listing). May 2025 and earlier. Accessed 2026-10-05.
- [4] U.S. Bureau of Labor Statistics. Occupational Employment and Wages, May 2025 (news release USDL-26-0725, May 15, 2026). May 2025. Accessed 2026-10-05.
- [5] U.S. Bureau of Labor Statistics. Occupational Employment and Wages Technical Note, May 2025. May 2025. Accessed 2026-10-05.
- [6] U.S. Bureau of Labor Statistics. OEWS Frequently Asked Questions (mean and median wages, wage definitions, top-coding change). Current as of May 2025 estimates. Accessed 2026-10-05.
- [7] U.S. Bureau of Labor Statistics. May 2025 OEWS Metropolitan and Nonmetropolitan Area Definitions. May 2025. Accessed 2026-10-05.
- [8] U.S. Bureau of Economic Analysis. Regional Price Parities by MSA, 2008 to 2024 (MARPP.zip, MARPP_MSA_2008_2024.csv). 2024 (released February 19, 2026). Accessed 2026-10-05.
- [9] U.S. Bureau of Economic Analysis. Regional Price Parities by State and Metro Area (data page, release schedule). 2024. Accessed 2026-10-05.
- [10] U.S. Bureau of Economic Analysis. Real Personal Consumption Expenditures by State and Real Personal Income by State, 2024 (news release). 2024. Accessed 2026-10-05.
- [11] U.S. Bureau of Economic Analysis. Methodology for Regional Price Parities, Real Personal Consumption Expenditures, and Real Personal Income (July 2025). Methodology, July 2025. Accessed 2026-10-05.
- [12] U.S. Census Bureau. Vintage 2025 population estimates for metropolitan and micropolitan statistical areas (cbsa-est2025-alldata.csv). July 1, 2025. Accessed 2026-10-05.
- [13] U.S. Census Bureau. Metropolitan and Micropolitan Statistical Areas Population Totals: 2020-2025 (Vintage 2025, March 2026). 2020 to 2025. Accessed 2026-10-05.
- [14] U.S. Office of Management and Budget. OMB Bulletin No. 23-01: Revised Delineations of Metropolitan Statistical Areas (July 21, 2023). July 2023 delineations. Accessed 2026-10-05.
- [15] U.S. Bureau of Labor Statistics. 2018 Standard Occupational Classification System: major groups and detailed occupation definitions. 2018 SOC. Accessed 2026-10-05.
- [16] U.S. Bureau of Labor Statistics. Occupational Outlook Handbook: Electricians. May 2025 pay; 2025 to 2035 projections. Accessed 2026-10-05.
- [17] U.S. Bureau of Labor Statistics. Union Members, 2025, Table 3: Union affiliation of employed wage and salary workers by occupation and industry. 2025 annual average. Accessed 2026-10-05.
- [18] U.S. Bureau of Labor Statistics. Union Members, 2025, Table 4: Median weekly earnings of full-time wage and salary workers by union affiliation. 2025 annual average. Accessed 2026-10-05.
- [19] U.S. Bureau of Labor Statistics. Employer Costs for Employee Compensation, June 2026, Table 4: Private industry workers by occupational and industry group. June 2026. Accessed 2026-10-05.
Tier 2: trade bodies, market research, company data (1)
- [20] Construction Coverage. The Best-Paying Cities for Construction Workers (methodology and large-metro results). OEWS May 2025 and BEA RPP 2024. Accessed 2026-10-05.