Age of Commercial Buildings in the United States: How Old Is the Stock?
- Primary data
- U.S. EIA Commercial Buildings Energy Consumption Survey (CBECS), 2018
- Data period
- 2018 reference year (2012 CBECS for comparison)
- Latest release used
- 2022-12-21
- Next release
- 2024 CBECS results not yet published; no date on the EIA status page as of 2026-10-05
- Geography
- United States, census regions and divisions
- Sources
- 22 (19 Tier 1)
The median age of commercial buildings in the United States was 36 years in EIA's 2018 CBECS, the latest release. The survey counted 5.9 million buildings with 96.4 billion square feet. Of those buildings, 46.3% were built before 1980. Religious worship, retail and public assembly buildings are oldest; the Northeast has the oldest stock.
How many commercial buildings are there in the US?
EIA's 2018 CBECS estimated 5.9 million U.S. commercial buildings holding 96.4 billion square feet. EIA has not yet published a newer count.
The Commercial Buildings Energy Consumption Survey (CBECS) estimated 5,918 thousand commercial buildings in the United States in 2018. EIA's relative standard error (RSE) for that total is 3.93%, which gives a 95% confidence range of 5,462 to 6,374 thousand buildings using EIA's published method.
Total commercial floor space was 96,423 million square feet in 2018. EIA's own worked example puts the 95% confidence range at 90,564 to 102,282 million square feet.
Commercial building (CBECS): A structure with more than 1,000 square feet of floor space in which at least half of the floor space is used for a purpose that is not residential, industrial or agricultural. The definition includes schools, hospitals, correctional institutions and religious buildings as well as stores, offices and warehouses. Buildings are classified by principal building activity, the use occupying the most floor space.
The stock grew between surveys. CBECS counted 5,557 thousand buildings and 87,093 million square feet in 2012, so the number of buildings rose 6.5% and floor space rose 10.7% by 2018. EIA rounds these changes to 6% and 11%.
Warehouse and storage was the most common building type in 2018 (1,004 thousand buildings), followed by office (970 thousand) and service (867 thousand).
What is the age of commercial buildings in the US?
Half of U.S. commercial buildings were at least 36 years old in 2018, and nearly half predate 1980. Floor space is younger than buildings because newer buildings are larger.
EIA reports a median age of 36 years for U.S. commercial buildings in 2018, and a median year of construction of 1981. EIA defines the year constructed as the year in which the major part or the largest portion of a building was built.
Buildings constructed before 1980 numbered 2,742 thousand in 2018, or 46.3% of all commercial buildings. They held 39,604 million square feet, or 41.1% of floor space. Buildings constructed before 2000 made up 75.3% of buildings and 71.1% of floor space.
Thousand buildings standing in 2018
Source: U.S. EIA, 2018 CBECS Table B2 (revised December 2022)
CB&C weighted the same distribution by floor space instead of building count. Half of U.S. commercial floor space was in buildings 32.1 years old or younger in 2018, about four years younger than the building median. The gap reflects building size: newer buildings hold more square feet each.
| Year constructed | Buildings (thousand) | Share of buildings | Floorspace (million sq ft) | Share of floorspace | Mean sq ft per building (thousand) | Median age (years) | RSE buildings (%) |
|---|---|---|---|---|---|---|---|
| Before 1920 | 329 | 5.6% | 3,600 | 3.7% | 10.9 | 120 | 12.81 |
| 1920 to 1945 | 379 | 6.4% | 5,646 | 5.9% | 14.9 | 88 | 10.66 |
| 1946 to 1959 | 517 | 8.7% | 6,937 | 7.2% | 13.4 | 65 | 8.14 |
| 1960 to 1969 | 685 | 11.6% | 10,360 | 10.7% | 15.1 | 54 | 6.38 |
| 1970 to 1979 | 831 | 14.0% | 13,061 | 13.5% | 15.7 | 43 | 7.38 |
| 1980 to 1989 | 794 | 13.4% | 13,465 | 14.0% | 17.0 | 34 | 6.96 |
| 1990 to 1999 | 921 | 15.6% | 15,535 | 16.1% | 16.9 | 22 | 7.51 |
| 2000 to 2009 | 924 | 15.6% | 17,500 | 18.1% | 18.9 | 13 | 8.03 |
| 2010 to 2018 | 537 | 9.1% | 10,319 | 10.7% | 19.2 | 4 | 10.95 |
| All buildings | 5,918 | 100.0% | 96,423 | 100.0% | 16.3 | 36 | 3.93 |
Shares and mean size computed by CB&C from EIA totals. Median age and RSE as published by EIA.
Source: [3][4] U.S. Energy Information Administration; U.S. Energy Information Administration
Other published figures use different methods. SMR Research reports an average (mean) age of 53.68 years at the end of 2022 from tax assessor records, a different definition of commercial property and a mean rather than a median. The Real Estate Roundtable repeats the 2018 CBECS median of 36 years. Altus Group's Q1 2026 figures (office 39 years, industrial and retail 41) cover only properties that sold.
Which commercial building types are oldest?
Religious worship buildings are the oldest major type (median 45 years). Lodging (27), warehouse and storage (28) and health care (29) are the youngest.
EIA's published 2018 median ages by principal building activity: religious worship 45 years, retail other than malls 43, public assembly 43, food service 39, office 38, education 37, mercantile 37, service 35, enclosed and strip malls 30, health care 29, warehouse and storage 28 and lodging 27.
Office buildings: the median U.S. office building was 38 years old in 2018, up from 33 in 2012. 47.2% of office buildings and 41.8% of office floor space were built before 1980. Half of office floor space was in buildings 34.5 years old or younger.
Percent of buildings in each type; CB&C calculation
Source: CB&C calculation from U.S. EIA, 2018 CBECS Table B8
Retail shows the widest gap between buildings and floor space. Retail buildings other than malls had a median age of 43 years, and 53.7% were built before 1980, yet only 32.3% of their floor space dates from before 1980. The older retail buildings are, on average, much smaller than the newer ones.
Education is the opposite case. 51.0% of education floor space was built before 1980, slightly more than the 48.1% share of education buildings, so older school and college buildings are slightly larger on average.
Some types aged quickly between surveys. The education median rose from 30 to 37 years and office from 33 to 38. Lodging fell from 37 to 27 years; EIA notes that more than one-third of lodging and health care buildings were built after 2000. Survey samples differ between 2012 and 2018, so small changes may not be significant.
| Building type | Buildings (thousand) | Floorspace (million sq ft) | Median age 2018 (EIA) | Median age 2012 (EIA) | Interpolated median age (buildings) | Median age of floorspace (CB&C) | Built before 1980 (buildings) | Built before 1980 (floorspace) |
|---|---|---|---|---|---|---|---|---|
| Office | 970 | 16,662 | 38 | 33 | 36.8 | 34.5 | 47.2% | 41.8% |
| Warehouse and storage | 1,004 | 17,483 | 28 | 26 | 28.0 | 27.5 | 33.9% | 34.6% |
| Service | 867 | 6,240 | 35 | 35 | 36.6 | 36.0 | 47.6% | 47.2% |
| Mercantile | 517 | 10,781 | 37 | 33 | 37.6 | 26.0 | 48.9% | 31.6% |
| Retail (other than mall) | 350 | 5,193 | 43 | 37 | 41.5 | 24.6 | 53.7% | 32.3% |
| Enclosed and strip malls | 167 | 5,588 | 30 | 28 | 30.5 | 27.8 | 39.5% | 30.9% |
| Public assembly | 488 | 7,192 | 43 | 41 | 41.4 | 31.1 | 53.5% | 44.5% |
| Religious worship | 439 | 5,471 | 45 | 41 | 46.0 | 39.2 | 62.6% | 50.9% |
| Education | 437 | 13,623 | 37 | 30 | 37.0 | 39.4 | 48.1% | 51.0% |
| Food service | 286 | 1,385 | 39 | 33 | 38.9 | 30.7 | 50.3% | 42.8% |
| Lodging | 207 | 6,976 | 27 | 37 | 26.1 | 30.1 | 33.3% | 33.3% |
| Health care | 137 | 4,018 | 29 | 31 | 29.8 | 29.4 | 32.8% | 38.0% |
| Inpatient | 9 | 2,259 | 35 | n/a | Q | Q | Q | Q |
| Outpatient | 129 | 1,760 | 29 | n/a | Q | Q | Q | Q |
| Food sales | 163 | 1,006 | 38 | 30 | Q | Q | Q | Q |
| Public order and safety | 81 | 1,538 | 32 | 23 | Q | Q | Q | Q |
| Vacant | 208 | 1,612 | 40 | 50 | Q | Q | Q | Q |
| Other | 113 | 2,435 | 28 | 28 | Q | Q | Q | Q |
EIA medians from Tables B2 (2018 and 2012). Interpolated and floor-space medians and pre-1980 shares are CB&C estimates from Tables B8 and B9. Q = not computed because EIA withholds bins.
Source: [3][6][1][2] U.S. Energy Information Administration; U.S. Energy Information Administration; U.S. Energy Information Administration; U.S. Energy Information Administration
Method check: CB&C's interpolated medians from the decade bins in Table B8 differ from EIA's published medians by 0.8 years on average and by at most 1.6 years across the 13 rows tested. That supports using the same method for floor-space medians, which EIA does not publish.
Which regions have the oldest commercial building stock?
The Northeast has the oldest commercial stock (median 46 years) and the South the youngest (33 years). The Middle Atlantic division is oldest of the nine divisions.
Ranking by the share of buildings built before 1980 in 2018: Northeast 57.0%, Midwest 49.9%, West 44.8% and South 40.5%. By floor space the order is Northeast 54.7%, Midwest 44.1%, South 35.7% and West 35.6%.
Percent of buildings and of floor space; CB&C calculation
Source: CB&C calculation from U.S. EIA, 2018 CBECS Tables B8 and B9
Median ages follow the same pattern: Northeast 46 years, Midwest 38, West 34 and South 33. The South holds the most buildings (2,143 thousand, 36% of the U.S. total) and the youngest stock, after its median rose from 29 years in 2012.
Among census divisions, the Middle Atlantic had the highest median age (48 years) and the highest computable pre-1980 share (59.3%). New England (44) and East North Central (41) followed. West South Central was youngest (30 years, 37.1% built before 1980).
Years
Source: U.S. EIA, 2018 CBECS Table B2
| Area | Level | Buildings (thousand) | Floorspace (million sq ft) | Mean sq ft per building (thousand) | Median age 2018 | Median age 2012 | Built before 1980 (buildings) | Built before 1980 (floorspace) |
|---|---|---|---|---|---|---|---|---|
| Northeast | Region | 793 | 15,951 | 20.1 | 46 | 46 | 57.0% | 54.7% |
| Midwest | Region | 1,719 | 25,932 | 15.1 | 38 | 37 | 49.9% | 44.1% |
| South | Region | 2,143 | 34,907 | 16.3 | 33 | 29 | 40.5% | 35.7% |
| West | Region | 1,264 | 19,633 | 15.5 | 34 | 32 | 44.8% | 35.6% |
| New England | Division | 275 | 3,749 | 13.6 | 44 | 37 | Q | n/a |
| Middle Atlantic | Division | 518 | 12,202 | 23.6 | 48 | 48 | 59.3% | n/a |
| East North Central | Division | 1,110 | 17,561 | 15.8 | 41 | 37 | 52.8% | n/a |
| West North Central | Division | 609 | 8,372 | 13.7 | 34 | 37 | Q | n/a |
| South Atlantic | Division | 1,034 | 17,923 | 17.3 | 33 | 28 | 40.7% | n/a |
| East South Central | Division | 347 | 5,404 | 15.6 | 36 | 33 | 46.7% | n/a |
| West South Central | Division | 762 | 11,580 | 15.2 | 30 | 29 | 37.1% | n/a |
| Mountain | Division | 484 | 7,680 | 15.9 | 33 | 29 | 42.8% | n/a |
| Pacific | Division | 780 | 11,952 | 15.3 | 35 | 34 | 46.2% | n/a |
Division pre-1980 shares from Table B4; Q where withheld bins fall on both sides of 1980.
Source: [3][6][1][2][5][4] U.S. Energy Information Administration; U.S. Energy Information Administration; U.S. Energy Information Administration; U.S. Energy Information Administration; U.S. Energy Information Administration; U.S. Energy Information Administration
Regional estimates carry more sampling error than the national total. The RSE for the Northeast building count is 9.87%, and division RSEs reach 20.95% (West North Central). CBECS publishes national, census region and census division estimates, so this report does not rank individual states.
How much commercial floor space was built each decade?
Of the floor space standing in 2018, the 2000s contributed the most: 17,500 million square feet. Older decades are smaller partly because some of their buildings no longer exist.
Floor space standing in 2018 by decade of construction: 10,360 million square feet from the 1960s, 13,061 million from the 1970s, 13,465 million from the 1980s, 15,535 million from the 1990s, 17,500 million from 2000 to 2009 and 10,319 million from 2010 to 2018 (a nine-year bin). Buildings from before 1946 held 9,246 million square feet.
Million square feet standing in 2018
Source: U.S. EIA, 2018 CBECS Table B2 (revised December 2022)
These figures count surviving floor space by vintage, not what was built in each decade. Buildings demolished before 2018 are missing, which understates older decades. For current construction volumes, see the CB&C commercial construction spending report.
How big are commercial buildings, and are newer ones bigger?
The average U.S. commercial building had 16.3 thousand square feet in 2018, but the median was 5.4 thousand. Buildings built since 2000 are about one-third larger on average than pre-1980 buildings.
Most commercial buildings are small. Buildings of 10,000 square feet or less were 70.8% of the 2018 stock but held 18.9% of floor space. Buildings over 100,000 square feet were 2.4% of buildings and held 34.3% of floor space.
Size rises with vintage. CB&C's group means from EIA totals: 14.4 thousand square feet per building for buildings built before 1980, 16.9 thousand for 1980 to 1999, and 19.0 thousand for 2000 to 2018, a difference of 31.9% between the newest and oldest groups. EIA's own means run from 10.9 thousand (before 1920) to 19.2 thousand (2010 to 2018).
Mean thousand square feet per building
Source: U.S. EIA, 2018 CBECS Table B1
Medians move much less: 4.5 thousand square feet for buildings built before 1920 and 6.0 thousand for buildings built 2010 to 2018. That pattern suggests the rise in the mean comes mostly from more large buildings in recent vintages rather than a bigger typical building.
| Building size (sq ft) | Buildings (thousand) | Share of buildings | Floorspace (million sq ft) | Share of floorspace | Median age (years) |
|---|---|---|---|---|---|
| 1,001 to 5,000 | 2,833 | 47.9% | 8,025 | 8.3% | 38 |
| 5,001 to 10,000 | 1,359 | 23.0% | 10,204 | 10.6% | 36 |
| 10,001 to 25,000 | 981 | 16.6% | 15,838 | 16.4% | 34 |
| 25,001 to 50,000 | 386 | 6.5% | 13,957 | 14.5% | 33 |
| 50,001 to 100,000 | 218 | 3.7% | 15,302 | 15.9% | 31 |
| 100,001 to 200,000 | 93 | 1.6% | 13,003 | 13.5% | 28 |
| 200,001 to 500,000 | 40 | 0.7% | 11,776 | 12.2% | 31 |
| Over 500,000 | 9 | 0.2% | 8,317 | 8.6% | 32 |
Shares computed by CB&C.
Source: [3] U.S. Energy Information Administration
Size and age interact: the smallest size class (1,001 to 5,000 square feet) had a median age of 38 years, while buildings of 100,001 to 200,000 square feet had a median age of 28 years.
What renovation and retrofit activity does the data show?
About one in three U.S. commercial buildings (34.3%) reported a renovation between 2000 and 2018. Lighting, HVAC and roof work led, and older buildings reported renovations more often.
CBECS asked respondents which renovations had been made since 2000. In 2018, 2,032 thousand buildings (34.3%) reported at least one, covering 45,165 million square feet (46.8% of floor space).
The most common were lighting upgrades (1,012 thousand buildings, 17.1%), HVAC equipment upgrades (1,006 thousand, 17.0%), roof replacements (847 thousand, 14.3%) and interior wall reconfiguration (709 thousand, 12.0%). Structural upgrades were rare (147 thousand, 2.5%).
| Renovation since 2000 | Buildings (thousand) | Share of all buildings | Floorspace (million sq ft) | Share of reports from pre-1980 buildings |
|---|---|---|---|---|
| Lighting upgrade | 1,012 | 17.1% | 29,098 | 61.8% |
| HVAC equipment upgrade | 1,006 | 17.0% | 27,575 | 63.4% |
| Roof replacement | 847 | 14.3% | 20,862 | 66.7% |
| Interior wall reconfiguration | 709 | 12.0% | 21,283 | 52.9% |
| Plumbing system upgrade | 584 | 9.9% | 15,537 | 67.8% |
| Fire, safety, or security upgrade | 570 | 9.6% | 19,985 | 62.1% |
| Electrical upgrade | 565 | 9.5% | 15,761 | 69.6% |
| Window replacement | 484 | 8.2% | 10,977 | 76.9% |
| Addition or annex | 327 | 5.5% | 10,854 | 50.2% |
| Insulation upgrade | 307 | 5.2% | 7,980 | 71.0% |
| Structural upgrade | 147 | 2.5% | 4,203 | 71.4% |
| Other | 43 | 0.7% | 1,168 | Q |
| Reduction in floorspace | 35 | 0.6% | 1,784 | Q |
More than one renovation type may apply. Last column: share of buildings reporting that renovation that were built before 1980.
Source: [1][2] U.S. Energy Information Administration; U.S. Energy Information Administration
Older vintages reported renovation more often: 49.2% of buildings built before 1946, 39.2% of 1970s buildings and 33.4% of 1990s buildings. Across all buildings built before 2000, 40.2% reported a renovation.
Pre-1980 buildings account for most envelope work: 66.7% of buildings reporting a roof replacement and 76.9% of those reporting window replacement were built before 1980.
| Year constructed | Buildings (thousand) | Any renovation since 2000 (thousand) | Share renovated | No renovation (thousand) | Roof replacement (thousand) | HVAC upgrade (thousand) |
|---|---|---|---|---|---|---|
| Before 1946 | 709 | 349 | 49.2% | 360 | 198 | 193 |
| 1946 to 1959 | 517 | 234 | 45.3% | 283 | 105 | 131 |
| 1960 to 1969 | 685 | 293 | 42.8% | 392 | 130 | 158 |
| 1970 to 1979 | 831 | 326 | 39.2% | 505 | 132 | 156 |
| 1980 to 1989 | 794 | 281 | 35.4% | 513 | 118 | 137 |
| 1990 to 1999 | 921 | 308 | 33.4% | 613 | 108 | 143 |
| 2000 to 2009 | 924 | 225 | 24.4% | 698 | 52 | 82 |
| 2010 to 2018 | 537 | 16 | 3.0% | 165 | Q | 7 |
Buildings built after 2000 had less time to be renovated. Q = withheld by EIA.
Source: [1] U.S. Energy Information Administration
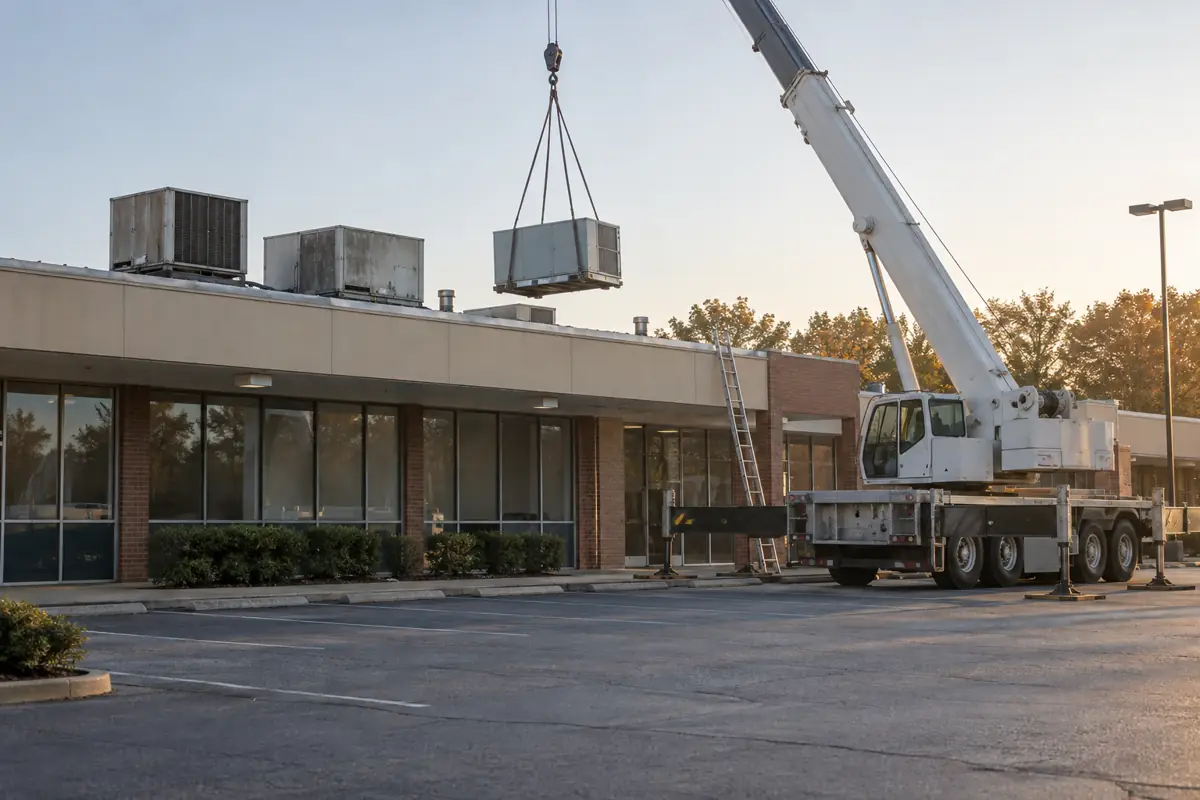
Census construction spending definitions count additions, alterations, renovations and major replacements, such as a complete roof or heating system replacement, as construction, and exclude maintenance and repairs. Census publishes an improvements line for residential construction only; the annual private construction table breaks nonresidential spending down by building type, not into new work and improvements, so this report does not estimate an improvements share.
What does the age of the stock mean for renovation demand?
The data describe a large base of older buildings with no recorded recent renovation: 1,540 thousand pre-1980 buildings reported none between 2000 and 2018.
In 2018, 56.2% of buildings constructed before 1980 reported no renovation of any kind since 2000. Those buildings held 16,731 million square feet, or 42.2% of pre-1980 floor space.
The 1980 line has a technical basis. The U.S. Department of Energy's commercial reference building models, which cover 16 building types representing about 70% of U.S. commercial buildings, use three vintages: new construction, post-1980 and pre-1980.
These counts are not a forecast of work. Renovations after 2018 are not observed, some buildings will be demolished rather than renovated, and the survey records whether work occurred, not its size or cost. Readers comparing contractors for this kind of work can see the CB&C directory of commercial renovation contractors. For where new-build activity is concentrated, see the data center construction projects tracker and the Commercial Builder Opportunity Index.
How long do commercial buildings last?
The federal sources reviewed here do not publish a measured physical lifespan for commercial buildings. The official figures are accounting assumptions, and many buildings outlast them.
The U.S. Bureau of Economic Analysis assumes service lives for private nonresidential structures when it estimates depreciation: 36 years for office buildings, 40 for commercial warehouses, 34 for other commercial buildings and multimerchandise shopping, 48 for hospitals, educational and religious buildings, 32 for lodging and 30 for amusement and recreational buildings. BEA states that these lives come from U.S. Treasury studies of the 1960s and 1970s.
The IRS assigns nonresidential real property, such as an office building, store or warehouse, a 39-year recovery period (Publication 946, 2025). This is a tax depreciation period, not a physical life.
The stock shows that buildings routinely exceed these figures. The median office building in 2018 (38 years) was older than BEA's 36-year office life (105.6% of it), and mercantile buildings reached 108.8% of the 34-year commercial life. In 2018, 329 thousand buildings (5.6%) dated from before 1920 and 12.0% from before 1946.
The numbers in one list
- The United States had an estimated 5,918 thousand commercial buildings in 2018, with a 95% confidence range of 5,462 to 6,374 thousand; EIA had published no 2024 results as of October 5, 2026.[1][10][7]
- U.S. commercial floor space totaled 96,423 million square feet in 2018 (95% range 90,564 to 102,282 million).[3][10]
- The median age of U.S. commercial buildings was 36 years in 2018, compared with 32 years in 2012; EIA puts the median year of construction at 1981.[3][6][8]
- In 2018, 46.3% of U.S. commercial buildings (2,742 thousand) were built before 1980, holding 41.1% of floor space.[1][2]
- In 2018, 75.3% of U.S. commercial buildings and 71.1% of floor space dated from before 2000.[1][2]
- Half of U.S. commercial floor space was in buildings about 32 years old or younger in 2018 (CB&C floor-space-weighted estimate), younger than the 36-year building median.[2]
- Religious worship buildings had the highest 2018 median age (45 years), followed by retail other than malls and public assembly (43 years each).[3]
- U.S. office buildings had a median age of 38 years in 2018, and 47.2% of the 970 thousand office buildings were built before 1980.[3][1]
- Warehouse and storage buildings had a 2018 median age of 28 years; 33.9% were built before 1980.[3][1]
- The Northeast had the oldest commercial stock in 2018: median age 46 years, with 57.0% of buildings built before 1980.[3][1]
- The Middle Atlantic division had the highest 2018 median age of the nine census divisions (48 years); West South Central had the lowest (30 years).[3]
- U.S. commercial buildings built 2010 to 2018 averaged 19.2 thousand square feet, against 10.9 thousand for buildings built before 1920.[4]
- Between 2000 and 2018, 34.3% of U.S. commercial buildings (2,032 thousand) reported at least one renovation; lighting (1,012 thousand) and HVAC upgrades (1,006 thousand) were most common.[1]
- Of U.S. commercial buildings built before 1980, 1,540 thousand (56.2%) reported no renovation between 2000 and 2018.[1]
- The 2018 median office building (38 years) was older than the 36-year service life BEA assumes for office structures; the IRS tax recovery period for nonresidential real property is 39 years.[3][15][16]
Calculations
Share of commercial buildings and floor space built before 1980 and before 2000
Formulasum of Table B8 (B9) bins before the cutoff / all buildings (floor space) x 100
Inputs: fact rows 1, 10, 2, 3, 4, 5; derived d1 to d8 (fact sheet rows)
Result: Before 1980: 46.3% of buildings, 41.1% of floor space. Before 2000: 75.3% of buildings, 71.1% of floor space.
Nearly half of buildings, but a smaller share of floor space, predate 1980, because older buildings are smaller on average.
Limitations: Bins are rounded to thousands; each bin carries its own RSE (6.38% to 10.95% for buildings). Survivors only.
Median age by building type, by count and by floor space
Formula2018.5 - Y, where Y is the year at which the cumulative distribution (newest bins first) reaches 50%, linearly interpolated within the decade bin
Inputs: Table B8 and B9 rows by principal building activity (fact rows 199 onward); derived m-series (fact sheet rows)
Result: Count-based medians match EIA's published medians within 1.6 years (mean gap 0.8). Floor-space medians: office 34.5, education 39.4, mercantile 26.0, warehouse 27.5, all buildings 32.1 years.
Floor-space medians are much younger than building medians for retail and mercantile, and older for education, showing where the large buildings sit in time.
Limitations: Linear interpolation assumes even construction within each bin. Types with withheld bins (food sales, public order and safety, other, vacant, inpatient, outpatient) are excluded; one withheld bin was imputed by subtraction for food service, retail other than mall and religious worship.
Floor space per building by vintage
FormulaTable B2 floor space / Table B2 buildings, by year-constructed bin and by group
Inputs: fact rows 812, 844 and the other B2 vintage rows; derived vs and vg series (fact sheet rows)
Result: 14.4 thousand sq ft (before 1980), 16.9 thousand (1980 to 1999), 19.0 thousand (2000 to 2018): 31.9% larger for the newest group.
Newer commercial buildings are larger on average, which is why floor space is younger than the building count.
Limitations: Means are pulled up by a few very large buildings; medians rise only from 4.5 to 6.0 thousand square feet.
Regional ranking by share of buildings built before 1980
Formulasum of pre-1980 bins / regional total x 100, ranked high to low; divisions by complement where pre-1980 bins are withheld
Inputs: fact rows 343, 361, 379, 397; Table B4 division rows; derived r and dv series (fact sheet rows)
Result: 1. Northeast 57.0%; 2. Midwest 49.9%; 3. West 44.8%; 4. South 40.5%. Highest division: Middle Atlantic 59.3%; lowest computable: West South Central 37.1%.
The older industrial North and East hold the oldest stock; Sun Belt divisions are younger.
Limitations: Regional RSEs of 7.73% to 10.93% on building counts; adjacent ranks (West and South) may not differ significantly. New England and West North Central could not be computed because bins are withheld on both sides of 1980.
Renovation coverage of the pre-1980 stock
Formulapre-1980 buildings reporting no renovation since 2000 / all pre-1980 buildings x 100 (same for floor space)
Inputs: fact rows 542, 543, 544, 545; derived rn3 to rn6 (fact sheet rows)
Result: 56.2% of pre-1980 buildings (1,540 thousand) and 42.2% of pre-1980 floor space (16,731 million sq ft) reported no renovation between 2000 and 2018.
A majority of older buildings had no recorded renovation between 2000 and the 2018 survey.
Limitations: Self-reported; minor work may be under-reported; renovations after 2018 are not observed.
Median age compared with BEA assumed service life
FormulaEIA median age 2018 / BEA service life x 100
Inputs: fact rows 782, 1083, 770, 1085, 802, 1084; derived sl series (fact sheet rows)
Result: Office 105.6%; mercantile 108.8%; religious worship 93.8%; lodging 84.4%; education 77.1%; warehouse 70.0%.
The median office and mercantile building has already passed the service life BEA assumes for depreciation.
Limitations: BEA lives are accounting assumptions from decades-old studies, and CBECS activity categories map only approximately to BEA structure types.
Questions people ask
How many commercial buildings are in the US?
About 5.9 million (5,918 thousand) in 2018, according to EIA's CBECS, with a 95% confidence range of 5,462 to 6,374 thousand. It is the most recent official count; EIA has not yet published 2024 results.
What is the average age of a commercial building?
EIA publishes a median, not a mean: 36 years in 2018. SMR Research, using tax assessor records and a different definition of commercial property, reports a mean of 53.68 years at the end of 2022. The two figures measure different things and are not directly comparable.
How old are office buildings in the US?
The median U.S. office building was 38 years old in 2018 (EIA), up from 33 in 2012. 47.2% of office buildings were built before 1980. Office properties that sold in Q1 2026 had a median age of 39 years (Altus Group).
How long do commercial buildings last?
The official sources reviewed here do not measure physical lifespan. BEA assumes 36 years for office buildings, 40 for warehouses and 48 for schools, hospitals and religious buildings when estimating depreciation, and the IRS uses a 39-year tax recovery period. In 2018, 329 thousand commercial buildings still in use had been built before 1920.
How much commercial floor space is there in the US?
96,423 million square feet (about 96.4 billion) in 2018, up 10.7% from 87,093 million in 2012. Buildings over 100,000 square feet held 34.3% of it.
Summary
- EIA's 2018 CBECS estimated 5.9 million U.S. commercial buildings with 96.4 billion square feet of floor space; no newer official count has been published as of October 5, 2026.
- The median U.S. commercial building was 36 years old in 2018, up from 32 years in the 2012 survey.
- Buildings constructed before 1980 made up 46.3% of buildings and 41.1% of floor space in 2018; buildings constructed before 2000 made up 75.3% and 71.1%.
- Religious worship buildings had the highest median age (45 years); lodging (27) and warehouse and storage (28) were the youngest major types. Office buildings had a median age of 38 years.
- The Northeast had the oldest stock: median age 46 years and 57.0% of buildings built before 1980, against 40.5% in the South.
- Newer buildings are larger: buildings built 2000 to 2018 averaged 19.0 thousand square feet, 31.9% more than buildings built before 1980 (14.4 thousand).
- 34.3% of buildings, holding 46.8% of floor space, reported at least one renovation between 2000 and 2018; 56.2% of pre-1980 buildings reported none.
Frequently asked questions
What counts as a commercial building in CBECS?
A building with more than 1,000 square feet where at least half of the floor space is used for something other than residential, industrial or agricultural purposes. Schools, hospitals and churches are included.
What share of U.S. commercial buildings were built before 1980?
46.3% in 2018 (2,742 thousand buildings), holding 41.1% of commercial floor space.
Has the commercial building stock gotten older since 2012?
Yes. The median age rose from 32 years in 2012 to 36 in 2018, even though the number of buildings grew 6.5%.
How old are warehouses in the US?
Warehouse and storage buildings had a median age of 28 years in 2018, among the youngest types; 33.9% were built before 1980.
How old are school buildings?
Education buildings had a median age of 37 years in 2018, up from 30 in 2012, and 51.0% of education floor space was built before 1980.
Which region has the oldest commercial buildings?
The Northeast: median age 46 years in 2018, with 57.0% of buildings built before 1980. The Middle Atlantic division was oldest at 48 years.
Which commercial building types are newest?
Lodging (median 27 years), warehouse and storage (28) and health care (29) in 2018.
Are newer commercial buildings bigger?
Yes on average: buildings built 2000 to 2018 averaged 19.0 thousand square feet, 31.9% more than pre-1980 buildings (14.4 thousand). Median sizes changed less.
How many commercial buildings have been renovated?
2,032 thousand (34.3%) reported at least one renovation between 2000 and 2018, most often lighting, HVAC or roof work.
When will newer CBECS data be released?
As of October 5, 2026, EIA had not published 2024 CBECS results and its status page gives no release date. This report will be updated when new tables appear.
Download the data
Every table in this report is available as a CSV under CC BY 4.0. The fact sheet lists each value with its source URL and access date.
- derived_metrics.csv (CSV)
- fact_sheet.csv (CSV)
- U.S. commercial buildings and floor space by year constructed, 2018 (CSV)
- Age of commercial buildings by building type, 2018 (CSV)
- Age of commercial buildings by census region and division, 2018 (CSV)
- U.S. commercial buildings by size class, 2018 (CSV)
- Renovations since 2000 reported by U.S. commercial buildings, 2018 (CSV)
- Renovation since 2000 by year constructed, 2018 (CSV)
For journalists and researchers
If you cite only a few, cite these
- Median age of U.S. commercial buildings: 36 years (2018, EIA CBECS).[3]
- Commercial buildings built before 1980: 46.3% of buildings and 41.1% of floor space (2018).[1][2]
- U.S. commercial stock: 5.9 million buildings and 96.4 billion square feet (2018).[1][3]
Most quotable statistics
- The median age of U.S. commercial buildings was 36 years in 2018, up from 32 in 2012 (EIA CBECS).[3][6]
- 46.3% of U.S. commercial buildings standing in 2018 were built before 1980.[1]
- In 2018, 71.1% of U.S. commercial floor space was in buildings built before 2000.[2]
- The median U.S. office building was 38 years old in 2018, older than the 36-year service life BEA assumes for office structures.[3][15]
- The Northeast had the oldest U.S. commercial stock in 2018: 57.0% of buildings were built before 1980, against 40.5% in the South.[1]
- Of U.S. commercial buildings built before 1980, 56.2% reported no renovation between 2000 and 2018.[1]
Press summary
U.S. commercial buildings had a median age of 36 years in 2018, up from 32 in 2012, according to a CB&C analysis of the EIA Commercial Buildings Energy Consumption Survey, still the latest official count as of October 2026. The survey estimated 5.9 million buildings with 96.4 billion square feet of floor space. 46.3% of buildings and 41.1% of floor space dated from before 1980. Religious worship buildings were oldest (median 45 years) and lodging youngest (27). Office buildings had a median age of 38, above the 36-year service life the Bureau of Economic Analysis assumes for offices. The Northeast had the oldest stock, with 57.0% of buildings built before 1980. Newer buildings are larger: 19.0 thousand square feet on average for 2000 to 2018 construction against 14.4 thousand before 1980. 34.3% of buildings reported a renovation between 2000 and 2018, while 56.2% of pre-1980 buildings reported none.
Suggested headlines
- Half of U.S. commercial buildings were at least 36 years old in the latest federal count
- Nearly half of America's 5.9 million commercial buildings predate 1980
- The median U.S. office building has outlived its 36-year accounting life
- Northeast leads the nation in aging commercial stock: 57.0% built before 1980
- 1.54 million pre-1980 commercial buildings reported no renovation from 2000 to 2018
How to cite this report
Commercial Builders & Contractors. (2026). Age of Commercial Buildings in the United States: How Old Is the Stock?. Retrieved from https://commercialbuildersandcontractors.com/commercial-building-stock-age/
Reuse license
Data and tables are licensed CC BY 4.0. Attribution: “Source: Commercial Builders & Contractors, Age of Commercial Buildings in the United States: How Old Is the Stock?” with a link to this page.
Methodology
Source selection: the primary source is the U.S. Energy Information Administration's Commercial Buildings Energy Consumption Survey (CBECS), the only nationally representative federal survey of commercial building characteristics. CB&C used the 2018 building characteristics tables B1, B2, B4, B8 and B9 (released September 2021, revised December 2022) and the 2012 Table B2 for comparison. On October 5, 2026, the CBECS status page listed no 2024 results, so 2018 is the latest release. Supporting federal sources: EIA methodology pages, the DOE commercial reference buildings page, BEA depreciation documentation, IRS Publication 946 and Census construction spending definitions. Three non-government sources (Altus Group, SMR Research, the Real Estate Roundtable) are cited only to compare published figures.
Inclusion and exclusion: every figure comes from a file or page opened on October 5, 2026 and saved in the report's raw folder. Cells EIA withholds (Q) are not used directly. ENERGY STAR Portfolio Manager materials were searched for a building-age distribution and none suitable was found; the NREL ComStock page could not be opened from our connection (see excluded.md). The Census annual private construction table shows improvements for residential construction only, so no nonresidential improvements share is estimated.
Conflicting numbers: where a secondary source restates CBECS, this report uses EIA's own tables. SMR Research's 53.68-year average uses assessor records and a mean, so it is shown as a separate measure, not reconciled. EIA's flipbook median year (1981) and Table B2 median age (36 years) are both EIA figures and are reported as published.
Derived metrics: shares are bin sums divided by totals. Median ages from decade bins use linear interpolation, measured at mid-2018 (age = 2018.5 minus the interpolated median year). Tested against EIA's published medians for all buildings and 12 building types, the method differed by 0.8 years on average and 1.6 years at most. Floor-space medians use the same method on Table B9. Where one bin is withheld, it is imputed as the total minus the other bins; where several pre-1980 bins are withheld, the pre-1980 share is computed as the total minus the post-1980 bins. Confidence ranges follow EIA's method: estimate plus or minus 1.96 times the standard error derived from the RSE. Every calculation is in derived_metrics.csv and reproducible with scripts/compute.py.
Limitations: CBECS describes the stock in 2018; buildings demolished earlier are absent, so older vintages are understated relative to what was built. Medians carry no published RSE. Regional and division estimates have larger sampling errors. Renovation data are self-reported and record whether work occurred, not its scope or cost. EIA drew a sample of about 16,000 buildings and kept 6,436 in the final data set; the partially weighted response rate was 54.7%, and EIA found little evidence of nonresponse bias. BEA service lives are accounting assumptions.
Last updated 2026-10-05. The report will be revised when EIA publishes 2024 CBECS building characteristics.
This report presents published data with its limitations. It is not legal, financial or investment advice.
Sources, ranked by quality
Tier 1: primary and official sources (19)
- [1] U.S. Energy Information Administration. 2018 CBECS Table B8. Year constructed, number of buildings. 2018 (released September 2021, revised December 2022). Accessed 2026-10-05.
- [2] U.S. Energy Information Administration. 2018 CBECS Table B9. Year constructed, floorspace. 2018 (released September 2021, revised December 2022). Accessed 2026-10-05.
- [3] U.S. Energy Information Administration. 2018 CBECS Table B2. Summary table: totals and medians, including median age of buildings. 2018 (released September 2021, revised December 2022). Accessed 2026-10-05.
- [4] U.S. Energy Information Administration. 2018 CBECS Table B1. Summary table: totals and means of floorspace. 2018 (released September 2021, revised December 2022). Accessed 2026-10-05.
- [5] U.S. Energy Information Administration. 2018 CBECS Table B4. Census region and division, number of buildings. 2018 (released September 2021, revised December 2022). Accessed 2026-10-05.
- [6] U.S. Energy Information Administration. 2012 CBECS Table B2. Summary table: totals and medians, including median age of buildings. 2012 (released February 2015, revised December 2016). Accessed 2026-10-05.
- [7] U.S. Energy Information Administration. Commercial Buildings Energy Consumption Survey (CBECS): data releases and status. Status page, latest entry December 10, 2024. Accessed 2026-10-05.
- [8] U.S. Energy Information Administration. 2018 CBECS Building Characteristics Highlights (flipbook). 2018. Accessed 2026-10-05.
- [9] U.S. Energy Information Administration. Commercial buildings have gotten larger in the United States, with implications for energy (Today in Energy). 2018 preliminary results (published December 3, 2020). Accessed 2026-10-05.
- [10] U.S. Energy Information Administration. What is an RSE? (CBECS relative standard errors and confidence ranges). 2018 CBECS. Accessed 2026-10-05.
- [11] U.S. Energy Information Administration. Response Rates and Nonresponse Bias in the 2018 CBECS Buildings Survey. 2018 CBECS. Accessed 2026-10-05.
- [12] U.S. Energy Information Administration. CBECS terminology (definitions of building and year constructed). Current. Accessed 2026-10-05.
- [13] U.S. Energy Information Administration. CBECS building type definitions. Current. Accessed 2026-10-05.
- [14] U.S. Department of Energy. Commercial Reference Buildings. Current. Accessed 2026-10-05.
- [15] U.S. Bureau of Economic Analysis. BEA Depreciation Estimates (rates of depreciation, service lives, declining-balance rates). Current fixed-asset accounts methodology. Accessed 2026-10-05.
- [16] Internal Revenue Service. Publication 946 (2025), How To Depreciate Property. Tax year 2025. Accessed 2026-10-05.
- [17] U.S. Census Bureau. Construction Spending: Definitions of construction. Current. Accessed 2026-10-05.
- [18] U.S. Energy Information Administration. How Were Buildings Selected for the 2018 CBECS? (sampling). 2018 CBECS. Accessed 2026-10-05.
- [22] U.S. Census Bureau. Annual Value of Private Construction Put in Place 2022 – 2025. 2022 to 2025 (annual). Accessed 2026-10-05.
Tier 2: trade bodies, market research, company data (3)
- [19] Altus Group. How property vintage shapes pricing across CRE's core sectors. Transactions through Q1 2026 (updated June 30, 2026). Accessed 2026-10-05.
- [20] SMR Research Corporation (commbuildings.com). Research: Age of U.S. Commercial Buildings. End of 2022. Accessed 2026-10-05.
- [21] The Real Estate Roundtable. Commercial Real Estate By The Numbers: 2024. Compiled 2024 from 2018 CBECS and other sources. Accessed 2026-10-05.