
Construction Productivity Tracker: US Labor Productivity Since 1987, With 2025 Data
- Primary data
- BLS labor productivity for selected construction industries; BLS major-industry (KLEMS) productivity; BEA GDP by industry
- Data period
- 1987 to 2025 (annual)
- Latest release used
- 2026-09-28
- Next release
- BLS construction industry measures: annual, next date not yet posted (2026 update was 2026-09-28). BEA industry data for Q3 2026: 2026-12-23.
- Geography
- United States
- Sources
- 20 (18 Tier 1)
US construction productivity has fallen since the 1980s. BLS output per hour for the construction sector was 10.5% lower in 2024 than in 1987 and 3.7% lower than in 2000, while manufacturing rose 109.9%. Industrial building, the only nonresidential building industry BLS measures, rose 83.2% from 2006 to 2025 despite a 12.1% drop in 2025.
This month in brief
- US construction sector labor productivity was 10.5% lower in 2024 than in 1987, the first year of the BLS industry series, and 3.7% lower than in 2000 (BLS).
- Over the same 1987 to 2024 span, manufacturing productivity rose 109.9% and private nonfarm business productivity rose 110.4%.
- Construction output grew 32.3% from 1987 to 2024 while hours worked grew 47.7%, so each hour produced less.
- Among the four construction industries BLS measures, industrial building productivity rose 83.2% from 2006 to 2025; single-family residential fell 18.6% over the same years.
- All four measured industries lost productivity in 2025: single-family -4.5%, multifamily -7.4%, industrial building -12.1% and highway, street and bridge -1.8%.
- Construction real value added per hour fell 1.0% in 2025 to $44.92 (2017 dollars), 18.8% below 1997, by CB&C's calculation from BEA and BLS data.
- Research that tests the price deflators finds measurement bias of no more than 0.5 percentage point a year, not enough to reverse the weak trend (Garcia and Molloy, FEDS 2023-052r1).
- Measured technology gains are small: information processing equipment contributed 0.0 percentage points a year to construction productivity growth from 1987 to 2024, against 0.1 in manufacturing.
Construction productivity in 2025: the latest annual readings
Every construction industry that BLS measures lost productivity in 2025, and a CB&C sector estimate fell 1.0%, while nonfarm business productivity rose 2.1%.
On 2026-09-28 BLS updated productivity for four construction industries through 2025, adding 2022 Economic Census data (BLS construction productivity highlights). Labor productivity fell 4.5% in single-family residential construction, 7.4% in multiple-family residential, 12.1% in industrial building and 1.8% in highway, street and bridge construction. These four industries cover about 12.5% of construction employment.
| Industry or measure | Year | Labor productivity | Real output | Hours worked | Source |
|---|---|---|---|---|---|
| Single-family residential construction (236115x) | 2025 | -4.5% | -4.3% | 0.2% | BLS construction industry measures |
| Multiple-family residential construction (236116x) | 2025 | -7.4% | -12.4% | -5.4% | BLS construction industry measures |
| Industrial building construction (236210) | 2025 | -12.1% | -13.2% | -1.2% | BLS construction industry measures |
| Highway, street and bridge construction (237310) | 2025 | -1.8% | -0.9% | 0.9% | BLS construction industry measures |
| Construction sector, real value added per hour (BEA output / BLS hours, CB&C calculation) | 2025 | -1.0% | -0.2% | 0.9% | BEA GDP by industry; BLS hours |
| Construction sector (NAICS 23), BLS labor productivity | 2024 | 2.0% | 3.6% | 1.6% | BLS major industries (KLEMS) |
| Nonfarm business sector | 2025 | 2.1% | n.a. | n.a. | BLS Productivity and Costs |
| Manufacturing sector | 2025 | 1.8% | n.a. | n.a. | BLS Productivity and Costs |
BLS construction industry hours exclude subcontractor labor. The value added per hour row divides BEA real value added by BLS hours for NAICS 236, 237 and 238 combined; it is a CB&C calculation, not a BLS measure. Sector-level BLS construction data end in 2024.
Source: [2][3][5][6][7] U.S. Bureau of Labor Statistics; U.S. Bureau of Labor Statistics; U.S. Bureau of Labor Statistics; U.S. Bureau of Labor Statistics; U.S. Bureau of Economic Analysis
BLS has not yet published a 2025 figure for the construction sector as a whole; its latest sector reading shows a 2.0% gain in 2024, as output rose 3.6% and hours 1.6% (BLS major-industry productivity file). For 2025, CB&C divided BEA real value added for construction by BLS hours. Real value added slipped 0.2% (BEA GDP by industry) while hours rose 0.9% (BLS hours by industry), so value added per hour fell 1.0% to $44.92 in 2017 dollars.
BEA real value added divided by BLS hours, chained 2017 dollars per hour
Source: CB&C calculation from U.S. Bureau of Economic Analysis GDP by industry (2026-09-30) and BLS hours (2026-08-26)
Has construction productivity declined since the 1980s and 2000s?
On the BLS sector measure, yes: output per hour was 10.5% lower in 2024 than in 1987 and 3.7% lower than in 2000. Most of the gap with manufacturing opened before 2007.
Labor productivity (output per hour of all workers), index 1987=100
Source: U.S. Bureau of Labor Statistics, major-industry and major-sector productivity files (2026 releases); CB&C rebasing to 1987=100
Indexed to 1987, the construction sector stood at 89.5 in 2024, manufacturing at 209.9 and private nonfarm business at 210.4 (BLS major-industry productivity file). The construction index peaked in 1987 and reached its low in 2022, 14.3% below the start. The quarterly BLS program, which runs through 2025, shows nonfarm business productivity up 111.6% and manufacturing up 117.1% since 1987 (BLS Productivity and Costs).
| Year | Construction (2017=100) | Manufacturing (2017=100) | Private nonfarm business (2017=100) | Construction (1987=100) | Manufacturing (1987=100) | Private nonfarm business (1987=100) |
|---|---|---|---|---|---|---|
| 1987 | 108.914 | 45.672 | 55.067 | 100.0 | 100.0 | 100.0 |
| 1990 | 99.306 | 48.002 | 57.422 | 91.2 | 105.1 | 104.3 |
| 2000 | 101.247 | 70.146 | 71.627 | 93.0 | 153.6 | 130.1 |
| 2007 | 94.121 | 94.692 | 86.274 | 86.4 | 207.3 | 156.7 |
| 2010 | 96.849 | 101.776 | 94.395 | 88.9 | 222.8 | 171.4 |
| 2019 | 94.366 | 97.816 | 103.702 | 86.6 | 214.2 | 188.3 |
| 2020 | 103.566 | 97.889 | 109.440 | 95.1 | 214.3 | 198.7 |
| 2024 | 97.501 | 95.882 | 115.861 | 89.5 | 209.9 | 210.4 |
Output per hour of all workers. Rebased columns divide each year by the 1987 value. Construction and manufacturing from the BLS major-industry (KLEMS) file; private nonfarm business from the BLS major-sector TFP file.
Source: [3][4] U.S. Bureau of Labor Statistics; U.S. Bureau of Labor Statistics
Compound annual growth in labor productivity, percent per year
Source: CB&C calculations from U.S. Bureau of Labor Statistics annual productivity indexes
By decade, construction productivity grew 0.2% a year in the 1990s and -0.4% a year in the 2000s, while manufacturing grew 3.9% and 3.8%. Since 2007 the picture differs: construction rose 3.6% to 2024 and manufacturing 1.3%, but private nonfarm business rose 34.3%. The 2020 reading is inflated by the pandemic fall in hours.
Research using BEA data back to the mid-20th century finds a longer decline. Goolsbee and Syverson report value added per construction worker about 40% lower in 2020 than in 1970 (BFI summary; Goolsbee and Syverson, NBER w30845); a Richmond Fed brief describes the same fall as more than 30% (Richmond Fed, 2025). The two figures come from the same research but different presentations, so this tracker reports both rather than choosing one.
Labor productivity: Real output divided by hours worked. BLS publishes it as an index (2017=100); a falling index means each hour of work produced less inflation-adjusted output than before.
Nonresidential vs residential construction productivity
Industrial building, the only nonresidential building industry with an official series, ended 2025 at 173.7 on a 2007=100 base, 77.7 points above single-family residential. BLS does not yet measure commercial building.
Labor productivity, index 2007=100
Source: U.S. Bureau of Labor Statistics, labor productivity for selected construction industries (released 2026-09-28); CB&C rebasing to 2007=100
From 2007 to 2019 productivity barely moved in any of the four industries: 0.1% a year in industrial building, -0.8% in single-family, -0.9% in multifamily and -0.1% in highway, street and bridge. From 2019 to 2025 industrial building grew 9.4% a year, single-family 1.0%, multifamily 1.6% and highway -3.2% (BLS construction industry tables).
Compound annual growth in labor productivity, percent per year
Source: CB&C calculations from U.S. Bureau of Labor Statistics construction industry productivity (released 2026-09-28)
| Industry | Series start | Change, start to 2025 | Annual growth, start to 2025 | Annual growth 2007 to 2019 | Annual growth 2019 to 2025 | Index 2025 (2007=100) | Employment 2025 (thousands) | Hours 2025 (millions) |
|---|---|---|---|---|---|---|---|---|
| Single-family residential construction (236115x) | 1987 | -3.9% | -0.1% | -0.8% | 1.0% | 96.0 | 618.9 | 1125.986 |
| Multiple-family residential construction (236116x) | 1987 | 95.2% | 1.8% | -0.9% | 1.6% | 98.5 | 64.5 | 121.509 |
| Industrial building construction (236210) | 2006 | 83.2% | 3.2% | 0.1% | 9.4% | 173.7 | 78.9 | 160.136 |
| Highway, street and bridge construction (237310) | 2002 | -24.5% | -1.2% | -0.1% | -3.2% | 81.2 | 426.3 | 922.823 |
CB&C calculations from BLS annual indexes (released 2026-09-28). Industrial building is the only nonresidential building industry BLS publishes.
Source: [2][1] U.S. Bureau of Labor Statistics; U.S. Bureau of Labor Statistics
Industrial building output rose 84.8% from 2007 to 2025 while its hours rose 6.4%. Single-family output fell 24.2% and hours fell 21.0%, leaving productivity 4.0% lower. Highway, street and bridge output fell 8.4% while hours rose 12.8%, leaving its productivity index at a series low in 2025.
For other segments BLS publishes hours but not output. Hours in nonresidential building construction (NAICS 2362) rose 34.2% from 1987 to 2025, against 29.9% in residential building (NAICS 2361); nonresidential work made up 43.4% of building construction hours in 2025. Building equipment contractors (NAICS 2382), the electrical, plumbing and HVAC trades, more than doubled their hours, up 105.0% (BLS hours by industry).
| Segment (NAICS) | 1987 | 2007 | 2019 | 2025 | Change 1987 to 2025 | Change 2019 to 2025 | Change 2024 to 2025 |
|---|---|---|---|---|---|---|---|
| Residential building construction (2361) | 1957.265 | 2536.618 | 2402.180 | 2542.734 | 29.9% | 5.9% | 1.0% |
| Nonresidential building construction (2362) | 1455.503 | 1830.093 | 1847.267 | 1952.693 | 34.2% | 5.7% | 1.1% |
| Construction of buildings (236) | 3412.439 | 4366.711 | 4249.447 | 4495.427 | 31.7% | 5.8% | 1.1% |
| Heavy and civil engineering (237) | 1780.442 | 2239.946 | 2477.055 | 2625.471 | 47.5% | 6.0% | 2.6% |
| Specialty trade contractors (238) | 7668.804 | 11988.685 | 11575.617 | 12105.926 | 57.9% | 4.6% | 0.5% |
| Building equipment contractors (2382) | 2680.914 | 4446.950 | 4922.323 | 5496.338 | 105.0% | 11.7% | 2.2% |
| Building finishing contractors (2383) | 2040.701 | 2890.463 | 2389.647 | 2200.884 | 7.8% | -7.9% | -1.3% |
| All construction (sum of 236, 237, 238) | 12861.685 | 18595.342 | 18302.119 | 19226.824 | 49.5% | 5.1% | 0.9% |
BLS hours for all workers. BLS does not publish output or productivity for these segments; hours show where labor input grew.
Source: [6] U.S. Bureau of Labor Statistics
Components: output growth vs hours growth
From 1987 to 2024 construction output grew 0.8% a year and hours 1.1% a year. Manufacturing grew output with fewer hours.
Construction sector, compound annual growth, percent per year
Source: U.S. Bureau of Labor Statistics, total factor productivity for major industries, Periods tab (data 1987 to 2024)
In log terms, construction added 28.0 points of output and 39.0 points of hours between 1987 and 2024, leaving labor productivity 11.0 points lower (BLS major-industry productivity file). Manufacturing output rose 52.7% while its hours fell 27.3%.
| Sector | Measure | 1987 to 2024 | 1987 to 1990 | 1990 to 2000 | 2000 to 2007 | 2007 to 2019 | 2019 to 2024 |
|---|---|---|---|---|---|---|---|
| Construction | Labor productivity | -0.3 | -3.0 | 0.2 | -1.0 | 0.0 | 0.7 |
| Construction | Real output | 0.8 | -1.4 | 2.5 | 0.2 | -0.1 | 1.5 |
| Construction | Hours worked | 1.1 | 1.7 | 2.3 | 1.3 | -0.1 | 0.8 |
| Construction | Total factor productivity | -0.5 | -0.5 | -0.5 | -1.3 | -0.1 | -0.7 |
| Construction | Capital intensity (capital per hour) | 1.4 | -1.5 | 2.7 | 3.9 | -0.3 | 1.0 |
| Construction | Contribution of capital intensity | 0.1 | -0.1 | 0.2 | 0.3 | 0.0 | 0.1 |
| Construction | Contribution of IT equipment intensity | 0.0 | 0.0 | 0.1 | 0.0 | 0.0 | 0.0 |
| Construction | Contribution of intermediate inputs intensity | 0.0 | -2.7 | 0.3 | -0.1 | 0.0 | 1.2 |
| Manufacturing | Labor productivity | 2.0 | 1.7 | 3.9 | 4.4 | 0.3 | -0.4 |
| Manufacturing | Real output | 1.2 | 1.8 | 3.8 | 1.2 | -0.4 | -0.8 |
| Manufacturing | Hours worked | -0.9 | 0.1 | 0.0 | -3.1 | -0.7 | -0.4 |
| Manufacturing | Total factor productivity | 0.7 | 0.3 | 1.5 | 1.9 | -0.2 | -0.1 |
| Manufacturing | Capital intensity (capital per hour) | 3.2 | 2.5 | 3.6 | 4.7 | 2.8 | 2.1 |
| Manufacturing | Contribution of capital intensity | 0.7 | 0.5 | 0.7 | 1.0 | 0.7 | 0.6 |
| Manufacturing | Contribution of IT equipment intensity | 0.1 | 0.1 | 0.2 | 0.1 | 0.0 | 0.0 |
| Manufacturing | Contribution of intermediate inputs intensity | 0.4 | 0.7 | 1.3 | 1.2 | -0.3 | -1.1 |
Published by BLS on the Periods tab of the major-industry TFP file. Contributions are percentage points of labor productivity growth.
Source: [3] U.S. Bureau of Labor Statistics
Total factor productivity, which nets out capital and materials as well as labor, fell 18.3% in construction from 1987 to 2024, or -0.5% a year. Capital per hour grew 1.4% a year in construction against 3.2% in manufacturing, and added 0.1 percentage point a year to construction labor productivity against 0.7 in manufacturing.
Why is construction productivity so low? Measurement and the evidence
Price deflators, uncounted subcontractor hours and small project sizes all affect the measured trend. The studies that test the measurement still find weak productivity growth.
The construction value-added price index rose 273.1% from 1997 to 2025, against 85.9% for GDP; since 2017 the gap is 55.2% vs 28.9% (BEA GDP by industry). Real construction value added rose only 5.8% from 1997 to 2025, while manufacturing rose 75.1% and GDP 93.6%. If construction prices are overstated, real output and productivity are understated.
Federal Reserve Board economists tested that idea. They estimate unobserved quality gains biased the single-family deflator up by 0 to 0.8 percentage point a year over 1987 to 2019, and biased construction productivity growth by no more than 0.5 percentage point a year, not enough to change the conclusion that growth was weak (Garcia and Molloy, FEDS 2023-052r1). The same paper notes every other major industry averaged at least 1% a year over 1987 to 2019. Goolsbee and Syverson find physical output per worker in housing falling or stagnant, a decline in how efficiently builders turn materials into output, and no shift of activity toward more productive states (Goolsbee and Syverson, NBER w30845).
BLS construction industry hours exclude subcontractors. A BLS study found that adding subcontractor hours cut multifamily productivity growth from 3.4% to 2.6% a year over 1987 to 2016 and highway growth from 0.0% to -2.2% a year over 2002 to 2016, while industrial building moved from 5.3% to 5.5% (Monthly Labor Review, 2018). BLS says missing undocumented workers have a minimal effect on growth rates (BLS construction productivity highlights).
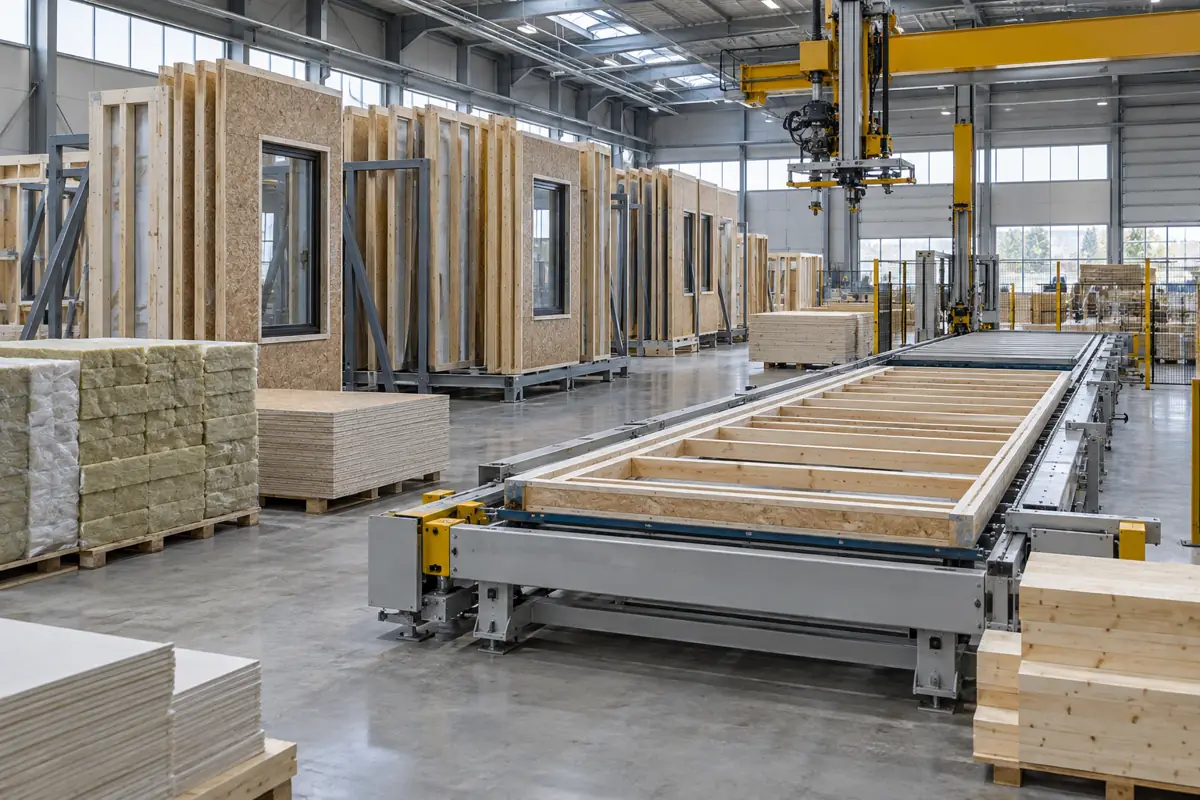
On causes, one NBER paper links the post-1970 decline to land-use rules that keep projects and builders small, and estimates residential builders could be about 60% more productive with a manufacturing-like size distribution (D'Amico and coauthors, NBER w33188). Goldman Sachs Research estimates rising US regulation since the 1960s cut annual construction productivity growth by 0.7 percentage point, and that prefabrication now accounts for 5% of new homes (Goldman Sachs Research); these are Tier 2 estimates. Fragmented contracting is another explanation offered by the McKinsey Global Institute; delivery models that combine design and construction are profiled in the design-build contractors guide.
| Source | Measure | Period | Estimate | Tier |
|---|---|---|---|---|
| Goolsbee and Syverson (NBER w30845), via BFI summary | Value added per worker, construction | 1970 to 2020 | about 40% lower | 1 |
| Richmond Fed Economic Brief 25-31 | Construction labor productivity | 1970 to 2020 | more than 30% lower | 1 |
| Garcia and Molloy (FEDS 2023-052r1) | Maximum bias to construction productivity growth from unmeasured quality | 1987 to 2019 | no more than 0.5 percentage point a year | 1 |
| Garcia and Molloy (FEDS 2023-052r1) | Upward bias in the single-family deflator | 1987 to 2019 | 0 to 0.8 percentage point a year | 1 |
| D'Amico, Glaeser, Gyourko, Kerr, Ponzetto (NBER w33188) | Residential builders' productivity if firm sizes matched manufacturing | 2020s estimate | about 60% higher | 1 |
| BLS Monthly Labor Review (Sveikauskas et al.) | Industrial construction productivity growth, direct vs with subcontractor hours | 2006 to 2016 | 5.3% vs 5.5% a year | 1 |
| BLS Monthly Labor Review (Sveikauskas et al.) | Multifamily productivity growth, direct vs with subcontractor hours | 1987 to 2016 | 3.4% vs 2.6% a year | 1 |
| Goldman Sachs Research (estimate) | US construction labor productivity, average annual change | since 1965 | -0.6% a year | 2 |
| McKinsey Global Institute (estimate) | Global construction labor productivity growth vs total economy and manufacturing | two decades to 2017 | 1% vs 2.8% and 3.6% a year | 2 |
Figures as published by each source; CB&C did not recompute them. Tier 2 figures are estimates by private firms and use different data and country coverage.
Source: [10][11][12][13][14][9][19][20] National Bureau of Economic Research; Becker Friedman Institute, University of Chicago; Federal Reserve Bank of Richmond; Board of Governors of the Federal Reserve System; National Bureau of Economic Research; U.S. Bureau of Labor Statistics; Goldman Sachs; McKinsey & Company
Does technology improve construction productivity?
Measured contributions from equipment and IT have been small in construction. The large gains cited for digital tools and offsite building are consultancy estimates, not measured results.
BLS growth accounting attributes 0.0 percentage points a year of construction labor productivity growth over 1987 to 2024 to information processing equipment, against 0.1 in manufacturing (BLS major-industry productivity file). Capital per hour in construction grew 2.0% a year from 1987 to 2015, according to BLS data cited in the Monthly Labor Review, 2018, so equipment use rose without a matching rise in measured output per hour.
Goldman Sachs Research estimates the share of industrial machines in construction costs rose from 4% in 1948 to 12% in 1968 and has held near 10% since the 1970s, and that technology added 0.8 percentage point a year to construction productivity since 1965 (Goldman Sachs Research). The McKinsey Global Institute estimated in 2017 that acting on regulation, contracts, design, procurement, site execution, digital tools and skills together could raise productivity by 50 to 60%. Neither estimate is an observed US outcome.
The strongest measured gain in the BLS data, industrial building's 9.4% a year from 2019 to 2025, coincided with a factory construction boom: spending on computer, electronic and electrical plants was 10.1 times higher in 2024 ($122.1 billion) than in 2021 ($12.1 billion) (Census construction spending). Survey data on software and AI use by contractors are tracked separately in AI adoption in construction.
When this tracker updates next
The construction productivity tracker updates when BLS or BEA publishes new annual industry data; the quarterly economy-wide figures update the comparison lines.
- BLS construction industry measures (four industries; the next edition would add 2026): published once a year; the 2026 update came on 2026-09-28 and no date for the next update was posted as of 2026-10-08 (BLS construction productivity highlights).
- BLS major-industry productivity with 2025 construction sector data: the 2024 data came out on 2025-12-19; no date for the 2025 data appeared on the BLS 2026 release calendar as checked on 2026-10-08.
- BLS Productivity and Costs, Q3 2026: preliminary on 2026-11-05 and revised on 2026-12-08 (BLS schedule).
- BEA GDP by industry for Q3 2026: 2026-12-23 (BEA schedule).
Each update replaces the latest-year rows in the tables and CSVs, recomputes the derived metrics from the raw files, and records the release date in the data card.
Momentum and share analysis
Indexed labor productivity, 1987=100
Formulaindex_y / index_1987 x 100 for each sector
Inputs: rows 1, 10, 17, 24, 29, 36 (fact sheet rows)
Result: 2024: construction 89.5, manufacturing 209.9, private nonfarm business 210.4
Rebasing to the first year of the BLS industry series shows the divergence directly: the private economy and manufacturing roughly doubled output per hour while construction lost ground.
Limitations: Sector-level construction output depends on BEA deflators; BLS warns 2-digit nonmanufacturing measures can be of inconsistent quality.
Change by decade (compound annual growth)
Formula((index_end / index_start)^(1/years) - 1) x 100
Inputs: rows 2, 3, 5, 7, 10, 18, 19, 21, 23, 24 (fact sheet rows)
Result: Construction: 0.2% (1990s), -0.4% (2000s), 0.7% (2010s), -1.5% (2020 to 2024). Manufacturing: 3.9%, 3.8%, -0.4%, -0.5%.
The gap with manufacturing is a 1990s and 2000s story. Since 2010 manufacturing productivity has also stalled, so the recent gap is with the private economy, not with factories.
Limitations: 2020 is distorted by the pandemic drop in hours, which lifted measured construction productivity that year.
Nonresidential vs residential gap
Formulaindustrial building index 2025 (2007=100) minus single-family index 2025 (2007=100)
Inputs: rows 186, 189, 145, 148 (fact sheet rows)
Result: 77.7 index points (173.7 vs 96.0)
Industrial building is the one nonresidential building industry with an official productivity series, and it outran both residential industries after 2019 as factory megaprojects lifted output faster than hours.
Limitations: Industrial building is a small, volatile industry; it does not represent commercial, office, school or health care building, which BLS does not yet measure.
Output growth vs hours growth decomposition
Formula100 x ln(LP ratio) = 100 x ln(output ratio) - 100 x ln(hours ratio), 1987 to 2024
Inputs: rows 11, 12, 13, 14 (fact sheet rows)
Result: 28.0 log points of output growth minus 39.0 of hours growth = -11.0 log points of labor productivity
Construction did not shrink; it added output. Hours simply grew faster, which is the arithmetic of a falling productivity index.
Limitations: Hours exclude unmeasured informal work; sector output uses the same deflators debated in the research.
Latest-year change in construction real value added per hour
Formula(BEA real value added 2025 / BLS hours 2025) / (same for 2024) - 1
Inputs: rows 282, 283, 238, 253, 258, 239, 254, 259 (fact sheet rows)
Result: -1.0% ($45.39 to $44.92 per hour, 2017 dollars)
This gives a 2025 sector reading a year before BLS publishes its own 2025 construction sector figure.
Limitations: Value added basis (BLS uses sectoral output) and a CB&C combination of two agencies' data; treat as an indicator, not an official statistic.
Deflator gap: construction prices vs GDP prices
Formula(price index 2025 / price index 1997 - 1) x 100, construction vs GDP
Inputs: rows 284, 285, 286, 287 (fact sheet rows)
Result: Construction value-added prices +273.1% vs GDP +85.9%, 1997 to 2025
Most of construction's nominal growth is classed as price, not quantity. If the construction deflator overstates inflation, real output and productivity are understated; the research bounds that error.
Limitations: Value-added price indexes mix output and input price effects (double deflation).
Industrial building output vs factory construction spending
Formulayear-on-year % change, Census private manufacturing construction spending vs BLS industrial building real output
Inputs: rows 300, 301, 302, 303, 198, 199, 232 (fact sheet rows)
Result: Spending +62.3% (2023), +20.4% (2024), -12.1% (2025); BLS output +49.4%, +21.0%, -13.2%
The industrial productivity surge and the 2025 drop track the factory construction cycle, which suggests large project volume, not a step change in methods, drove most of the swing.
Limitations: Census spending is in current dollars and classified by structure type; BLS output is deflated and classified by contractor industry. Correlation only.
Findings to track
- US construction sector labor productivity fell 10.5% from 1987 to 2024, a compound rate of -0.3% a year.[3]
- US manufacturing labor productivity rose 109.9% from 1987 to 2024, or 2.0% a year.[3]
- US private nonfarm business labor productivity rose 110.4% from 1987 to 2024.[4]
- Construction sector labor productivity hit its series low in 2022, 14.3% below 1987, then rose 2.0% in 2024.[3]
- From 2007 to 2024, US construction labor productivity rose 3.6%, manufacturing 1.3% and private nonfarm business 34.3%: the construction gap with manufacturing opened before 2007.[3][4]
- US construction real output grew 32.3% from 1987 to 2024 while hours worked grew 47.7%.[3]
- US construction total factor productivity fell 18.3% from 1987 to 2024.[3]
- US industrial building construction (NAICS 236210) labor productivity rose 83.2% from 2006 to 2025, growing 9.4% a year from 2019 to 2025.[2]
- US single-family residential construction productivity fell 18.6% from 2006 to 2025 and was 3.9% below its 1987 level in 2025.[2]
- US multiple-family residential construction productivity was 95.2% higher in 2025 than in 1987, despite falls of 7.1% in 2024 and 7.4% in 2025.[2]
- US highway, street and bridge construction productivity was 24.5% lower in 2025 than in 2002.[2]
- US industrial building construction productivity fell 12.1% in 2025 as output fell 13.2%, after a record 45.8% gain in 2023.[1][2]
- US construction real value added per hour fell 1.0% in 2025 to $44.92 in 2017 dollars, 18.8% below 1997 (CB&C calculation).[7][6]
- The BEA price index for US construction value added rose 273.1% from 1997 to 2025, against 85.9% for GDP.[7]
- Unmeasured quality improvements biased US construction productivity growth down by no more than 0.5 percentage point a year over 1987 to 2019, according to Federal Reserve Board economists.[13]
Questions people ask
Why is construction productivity so low?
Measured US construction productivity is low because hours grew faster than real output: from 1987 to 2024 output rose 32.3% and hours 47.7% (BLS). Part of the gap is measurement: construction prices rose 273.1% from 1997 to 2025 against 85.9% for GDP (BEA), but Federal Reserve research caps the resulting bias at 0.5 percentage point a year. Research points to small firms and projects, land-use rules and weak reallocation as real causes.
Has construction productivity declined?
Yes, on the sector measure. BLS output per hour in US construction was 10.5% lower in 2024 than in 1987, and research using BEA data finds value added per worker about 40% lower in 2020 than in 1970. Industry detail is mixed: industrial building rose 83.2% from 2006 to 2025 and multifamily rose 95.2% from 1987 to 2025, while highway construction fell 24.5% since 2002.
How does construction productivity compare to manufacturing?
US manufacturing labor productivity rose 109.9% from 1987 to 2024, or 2.0% a year, while construction changed -0.3% a year, a gap of 2.3 percentage points a year (BLS). The gap opened in the 1990s and 2000s; from 2007 to 2024 construction rose 3.6% and manufacturing 1.3%.
Does technology improve construction productivity?
The measured effect so far is small. BLS attributes 0.0 percentage points a year of construction productivity growth over 1987 to 2024 to IT equipment and 0.1 point to capital per hour. Goldman Sachs Research estimates technology added 0.8 point a year since 1965, offset by regulation. McKinsey's 50 to 60% potential gain is an estimate, not an observed result.
What is labor productivity in construction?
Labor productivity in construction is real output per hour worked. BLS deflates construction revenue with price indexes and divides by hours of all workers, including partners and proprietors, who made up 19% of construction hours in 2012 (BLS Monthly Labor Review). Its industry measures exclude subcontractor hours. In 2025 US construction produced about $44.92 of real value added per hour in 2017 dollars (CB&C calculation from BEA and BLS).
Download the data
Every table in this report is available as a CSV under CC BY 4.0. The fact sheet lists each value with its source URL and access date.
- derived_metrics.csv (CSV)
- fact_sheet.csv (CSV)
- Latest annual construction productivity readings: change from the prior year (CSV)
- Labor productivity indexes since 1987: construction, manufacturing and private nonfarm business (CSV)
- Construction vs manufacturing: compound annual growth by period, 1987 to 2024 (percent per year) (CSV)
- The four BLS construction industries: productivity since the series start, 2007 to 2019 and 2019 to 2025 (CSV)
- Hours worked by construction segment, 1987 to 2025 (millions of hours) (CSV)
- What research estimates say about the long-run construction productivity trend and its measurement (CSV)
For journalists and researchers
If you cite only a few, cite these
- US construction labor productivity: -10.5% from 1987 to 2024 vs +109.9% in manufacturing (BLS, data released 2025-12-19).[3]
- US industrial building construction productivity: +83.2% from 2006 to 2025, -12.1% in 2025 (BLS, released 2026-09-28).[2]
- US construction real value added per hour, 2025: $44.92 (2017 dollars), -1.0% from 2024 (CB&C calculation from BEA and BLS).[7][6]
Most quotable statistics
- US construction labor productivity was 10.5% lower in 2024 than in 1987, while manufacturing productivity rose 109.9% (BLS).[3]
- US construction output grew 32.3% from 1987 to 2024, but hours worked grew 47.7% (BLS).[3]
- US industrial building construction productivity rose 83.2% from 2006 to 2025, while single-family residential fell 18.6% (BLS).[2]
- All four US construction industries measured by BLS lost productivity in 2025, led by industrial building at -12.1%.[2]
- US construction real value added per hour fell 1.0% in 2025 and was 18.8% below its 1997 level (CB&C calculation from BEA and BLS data).[7][6]
- Construction prices measured by BEA rose 273.1% from 1997 to 2025, against 85.9% for GDP.[7]
- Deflator error can explain no more than 0.5 percentage point a year of weak US construction productivity growth, Federal Reserve Board research finds.[13]
Press summary
US construction productivity remains below its 1980s level, according to a CB&C tracker built from Bureau of Labor Statistics and Bureau of Economic Analysis data. BLS output per hour for the construction sector was 10.5% lower in 2024 than in 1987, while manufacturing rose 109.9% and the private nonfarm economy 110.4%. Construction output grew 32.3% over the period, but hours grew 47.7%. The one nonresidential building industry BLS measures, industrial building, gained 83.2% from its 2006 series low to 2025 during a wave of factory projects, then fell 12.1% in 2025 as output dropped. All four measured construction industries declined in 2025, and CB&C estimates sector value added per hour fell 1.0%. Federal Reserve research finds price measurement explains no more than 0.5 percentage point a year of the weakness. BLS does not yet publish a productivity measure for commercial building construction, and says it may add warehouses, schools, offices and contractor industries using Census microdata.
Suggested headlines
- US construction productivity is 10.5% below 1987 as manufacturing doubles
- Factory boom lifted industrial building productivity 83.2%, then 2025 reversed part of it
- All four construction industries measured by BLS lost productivity in 2025
- Construction added 32.3% more output since 1987 but 47.7% more hours
- Deflator error explains at most 0.5 point a year of construction's productivity gap, Fed study finds
How to cite this report
Commercial Builders & Contractors. (2026). Construction Productivity Tracker: US Labor Productivity Since 1987, With 2025 Data. Retrieved from https://commercialbuildersandcontractors.com/construction-productivity/
Reuse license
Data and tables are licensed CC BY 4.0. Attribution: “Source: Commercial Builders & Contractors, Construction Productivity Tracker: US Labor Productivity Since 1987, With 2025 Data” with a link to this page.
Frequently asked questions
What is the latest construction productivity reading?
For 2025, BLS reports labor productivity changes of -4.5% in single-family, -7.4% in multifamily, -12.1% in industrial building and -1.8% in highway construction. The latest BLS sector figure is 2024, up 2.0%.
How much has US construction productivity fallen since 1987?
BLS construction sector labor productivity was 10.5% lower in 2024 than in 1987, a rate of -0.3% a year. Private nonfarm business productivity rose 110.4% over the same years.
Did construction productivity rise or fall in 2025?
It fell. All four BLS construction industries declined in 2025, and construction real value added per hour fell 1.0% to $44.92 (2017 dollars) by CB&C's calculation, as real value added slipped 0.2% and hours rose 0.9%.
Which construction industry has the fastest productivity growth?
Industrial building construction (NAICS 236210): labor productivity rose 83.2% from 2006 to 2025 and 9.4% a year from 2019 to 2025, including a record 45.8% in 2023 (BLS).
Does BLS publish productivity for commercial building construction?
No. BLS covers single-family, multifamily, industrial building and highway construction, about 12.5% of construction employment. It says it may add at least 7 more industries, such as warehouses, schools and offices.
Why did industrial building productivity jump in 2023 and 2024?
Output rose faster than hours: 49.4% vs 2.5% in 2023 (BLS). Private manufacturing construction spending rose 62.3% in 2023 and 20.4% in 2024 (Census), then fell 12.1% in 2025, when industrial productivity fell 12.1%.
Do subcontractors distort construction productivity numbers?
They can. BLS industry hours exclude subcontractors; counting them lowered multifamily growth from 3.4% to 2.6% a year over 1987 to 2016 in a BLS study. Sector-level hours include specialty trade contractors (NAICS 238), whose hours grew 57.9% from 1987 to 2025.
Is the construction productivity decline caused by bad price deflators?
Only in small part, according to the research. Federal Reserve Board economists put the maximum bias at 0.5 percentage point a year over 1987 to 2019, and Goolsbee and Syverson find physical output per worker in housing falling or flat.
How big is construction in the US economy?
Construction value added was 4.3% of US GDP in 2025 (BEA, 2026-09-30 release); the BLS highlights page, published two days earlier, cites 4.4%. Construction held 5.2% of nonfarm payroll jobs in 2025 (BLS).
When is the next construction productivity data release?
BLS updates its construction industry measures once a year (last on 2026-09-28; next date not yet posted). Economy-wide Q3 2026 productivity comes on 2026-11-05, and BEA industry data for Q3 2026 on 2026-12-23.
Methodology
Source selection: the tracker uses official statistics first. BLS Office of Productivity and Technology files supply the construction industry, construction sector, manufacturing and private nonfarm business measures; BEA GDP by industry supplies real value added and price indexes; Census construction spending supplies context on factory construction. Peer-reviewed or institutional research (NBER, Federal Reserve Board, Richmond Fed, BLS Monthly Labor Review) is used for measurement and causes. Goldman Sachs and McKinsey figures are labelled Tier 2 estimates.
Inclusion and exclusion: every figure comes from a file or page opened on 2026-10-08 and saved in raw/. Claims that could not be opened or checked, including the paywalled Goldman Sachs report and figures quoted second-hand from other studies, were excluded (see excluded.md). The brief's assumption that BLS publishes productivity for NAICS 2361, 2362 and 2381 was checked and is incorrect: BLS publishes productivity for 236115x, 236116x, 236210 and 237310, and hours only for the broader segments.
Conflicting numbers: BEA's 2026-09-30 release puts construction at 4.3% of 2025 GDP while the BLS highlights page, written two days earlier, cites 4.4%; the tracker uses BEA and notes both. Research describes the 1970 to 2020 decline as about 40% (BFI summary) and more than 30% (Richmond Fed); both are shown. KLEMS construction hours and the sum of NAICS 236, 237 and 238 hours differ by 0.1% in 2024.
Derived metrics: percent changes are (end / start – 1) x 100; compound annual growth is ((end / start)^(1/years) – 1) x 100; rebased indexes divide each year by the base year. Real value added per hour divides BEA real value added (chained 2017 dollars) by BLS hours for NAICS 236, 237 and 238. Every formula, input row and result is in derived_metrics.csv; scripts in scripts/ rebuild all outputs from raw/.
Limitations: BLS cautions that 2-digit nonmanufacturing productivity measures can be of inconsistent quality. Construction industry hours exclude subcontractors. Industrial building is small and volatile and does not represent commercial building. The 2025 multifamily deflator is an interim Census-based extension. Census spending is in current dollars. The value added per hour series mixes two agencies' data and is not an official statistic. This page is research, not investment, legal or business advice.
Last updated 2026-10-08, using BLS construction industry data released 2026-09-28, BEA GDP by industry published 2026-09-30, BLS hours released 2026-08-26 and BLS Productivity and Costs released 2026-09-03.
This report presents published data with its limitations. It is not legal, financial or investment advice.
Sources, ranked by quality
Tier 1: primary and official sources (18)
- [1] U.S. Bureau of Labor Statistics. BLS Productivity Highlights: Construction Labor Productivity (updated 2026-09-28). 1987 to 2025. Accessed 2026-10-08.
- [2] U.S. Bureau of Labor Statistics. Labor productivity and costs measures for selected construction industries (construction-table.xlsx, released 2026-09-28). 1987 to 2025. Accessed 2026-10-08.
- [3] U.S. Bureau of Labor Statistics. Total factor productivity for major industries (KLEMS) xlsx, file dated 2026-03-19, data 1987 to 2024. 1987 to 2024. Accessed 2026-10-08.
- [4] U.S. Bureau of Labor Statistics. Total factor productivity for major sectors xlsx (private nonfarm business), released 2026-03-19. 1987 to 2025. Accessed 2026-10-08.
- [5] U.S. Bureau of Labor Statistics. Labor productivity and related measures for major sectors xlsx, released 2026-09-03. 1947 to Q2 2026. Accessed 2026-10-08.
- [6] U.S. Bureau of Labor Statistics. Hours worked and employment, detailed industries xlsx, released 2026-08-26. 1987 to 2025. Accessed 2026-10-08.
- [7] U.S. Bureau of Economic Analysis. GDP by Industry: Value Added tables (ValueAdded.xlsx), published 2026-09-30. 1997 to 2025 (annual), 2005 Q1 to 2026 Q2. Accessed 2026-10-08.
- [8] U.S. Census Bureau. Value of Private Construction Put in Place, not seasonally adjusted (privtime.xlsx), data through August 2026. 1993 to August 2026. Accessed 2026-10-08.
- [9] U.S. Bureau of Labor Statistics. Measuring productivity growth in construction (Sveikauskas, Rowe, Mildenberger, Price, Young), Monthly Labor Review, January 2018. 1987 to 2016. Accessed 2026-10-08.
- [10] National Bureau of Economic Research. The Strange and Awful Path of Productivity in the U.S. Construction Sector, NBER Working Paper 30845 (Goolsbee and Syverson), January 2023. 1950 to 2020. Accessed 2026-10-08.
- [11] Becker Friedman Institute, University of Chicago. Research brief: The Strange and Awful Path of Productivity in the US Construction Sector, 2023-01-19. 1970 to 2020. Accessed 2026-10-08.
- [12] Federal Reserve Bank of Richmond. Five Decades of Decline: U.S. Construction Sector Productivity (Chen Yeh), Economic Brief 25-31, August 2025. 1948 to 2024. Accessed 2026-10-08.
- [13] Board of Governors of the Federal Reserve System. Reexamining Lackluster Productivity Growth in Construction (Garcia and Molloy), FEDS 2023-052r1, revised April 2025. 1980 to 2019. Accessed 2026-10-08.
- [14] National Bureau of Economic Research. Why Has Construction Productivity Stagnated? The Role of Land-Use Regulation, NBER Working Paper 33188 (D'Amico, Glaeser, Gyourko, Kerr, Ponzetto), November 2024. 1900 to 2023. Accessed 2026-10-08.
- [15] U.S. Bureau of Labor Statistics. Productivity news releases (release dates and summaries). 2025 to 2026 releases. Accessed 2026-10-08.
- [16] U.S. Bureau of Labor Statistics. Schedule of releases for Productivity and Costs. 2026 releases. Accessed 2026-10-08.
- [17] U.S. Bureau of Economic Analysis. BEA release schedule 2026. 2026 releases. Accessed 2026-10-08.
- [18] U.S. Bureau of Labor Statistics. BLS release calendar 2026. 2026 releases. Accessed 2026-10-08.
Tier 2: trade bodies, market research, company data (2)
- [19] Goldman Sachs. Why Has Productivity in the US Construction Industry Stagnated? (Goldman Sachs Insights, 2026-02-12). 1965 to 2020s. Accessed 2026-10-08.
- [20] McKinsey & Company. Reinventing construction through a productivity revolution (McKinsey Global Institute, 2017-02-27). about 1995 to 2015. Accessed 2026-10-08.