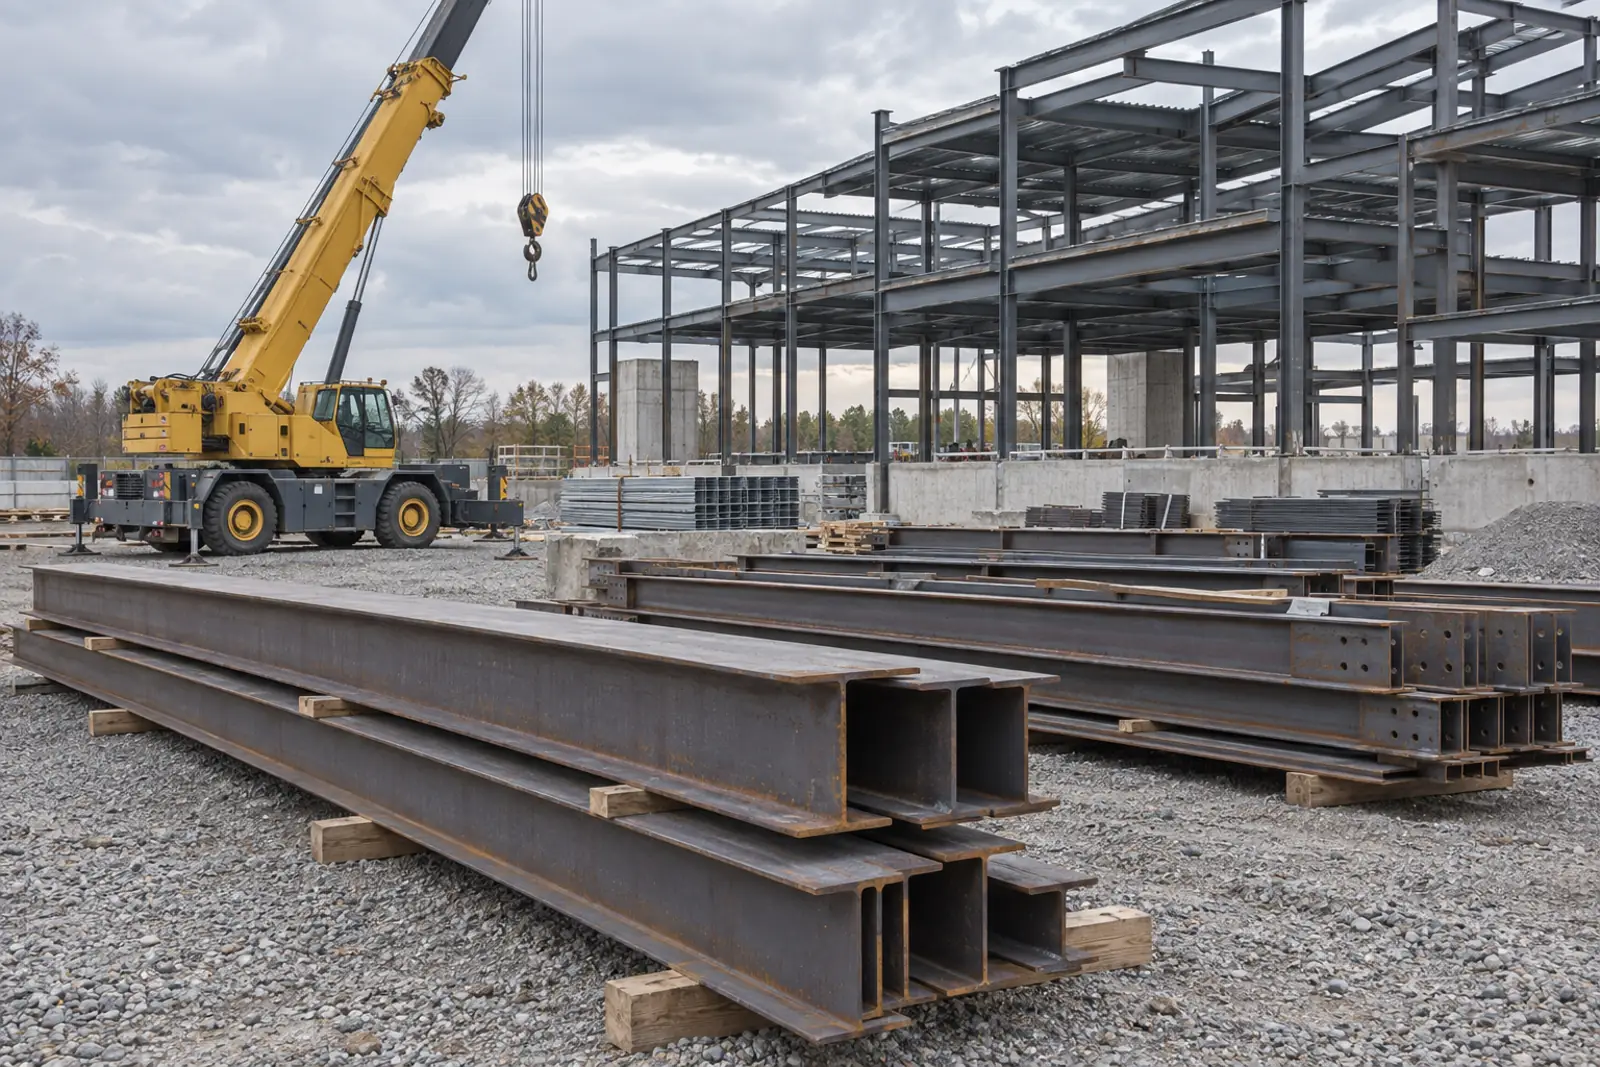
Commercial Construction Costs 2026: The CB&C Margin Squeeze Index
- Primary data
- BLS Producer Price Indexes (building-type output PPIs and inputs to new nonresidential construction), BLS Current Employment Statistics, BLS Employment Cost Index
- Data period
- January 2020 to August 2026 (ECI to Q2 2026)
- Latest release used
- 2026-09-10
- Next release
- 2026-10-15 (September 2026 PPI)
- Geography
- United States
- Sources
- 22 (16 Tier 1)
Commercial construction costs 2026: BLS prices for new nonresidential buildings rose 5.3% in the 12 months to August 2026, from 4.3% for warehouses to 5.9% for offices. Contractors' input prices rose 8.9% and nonresidential building wages 5.2%, so bid prices are keeping pace with labor but not with materials and energy.
How the index is built
CB&C Margin Squeeze Index, 12-month, by building type
FormulaMSI = 12-month % change in BLS output PPI for the building type minus 12-month % change in PPI inputs to new nonresidential construction (WPUIP231200)
Inputs: rows 1, 2, 7, 8, 13, 14, 19, 20, 25, 26, 31, 32, 67, 68 (fact sheet rows)
Result: All new nonresidential buildings -3.6 pp; offices -3.0; industrial -3.1; schools -3.7; health care -3.9; warehouses -4.6
Every building type shows input costs rising faster than finished-building prices over the 12 months to August 2026. Offices are the least squeezed and warehouses the most.
Limitations: Output PPIs are model-based and already embed material and installation costs plus margin; the input index excludes labor and imports. A negative reading signals compression of the price-over-input spread, not a measured fall in contractor profit.
Wage-weighted Margin Squeeze Index
FormulaMSI_w = output 12-mo % - (0.60 x inputs 12-mo % + 0.40 x average hourly earnings 12-mo %, nonresidential building construction, CEU2023620003)
Inputs: rows 67, 68, 211, 212 plus output rows in d1 (fact sheet rows)
Result: All new nonresidential buildings -2.1 pp; range -1.5 (offices) to -3.1 (warehouses). Break-even labor weight for the 12-month aggregate: 0.97
Adding labor narrows but does not erase the squeeze, because wages (+5.2%) rose about as fast as building prices (+5.3%) while non-labor inputs rose 8.9%.
Limitations: The 0.40 labor weight is a CB&C assumption, not a measured cost share, and is tested at 0.30 and 0.50. Average hourly earnings exclude benefits and shift with workforce mix.
Cumulative change since January 2020
Formula(August 2026 index / January 2020 index - 1) x 100 for each series
Inputs: rows 31, 36, 67, 72, 211, 216 and the Jan 2020 rows of every series in tables t3 to t5 (fact sheet rows)
Result: Outputs +40.0% (schools) to +54.4% (offices), all new nonresidential buildings +46.3%; inputs +52.8%; hourly earnings +32.3%; materials-only squeeze -6.5 pp; wage-weighted squeeze (0.40) +1.7 pp; break-even labor weight 0.32
Since January 2020 non-labor inputs outran building prices, but wages lagged both. Once labor carries a weight above 0.32, the cumulative spread turns positive.
Limitations: Nominal changes; the base month predates the pandemic shock. Different series start dates and survey designs.
Material heat ranking
FormulaRank of 16 commodity PPIs by 12-month % change, August 2025 to August 2026
Inputs: rows for each material series in table t5 (Aug 2026 and Aug 2025 levels) (fact sheet rows)
Result: Diesel fuel +77.8%, aluminum mill shapes +27.3%, copper wire and cable +27.2%, steel mill products +23.4% lead; gypsum products +0.2%, insulation +1.1%, ready-mix concrete +2.3% trail
Price pressure is concentrated in energy, primary metals and electrical gear; mineral products such as concrete, gypsum and glass are close to flat.
Limitations: Domestic producer prices, not delivered or contractor prices; weights in a given project vary widely.
Sensitivity of the squeeze sign to the measurement window
FormulaSqueeze over window k = % change in WPU801 over k minus % change in WPUIP231200 over k, for k = 3 months, 6 months, year to date, 12 months, since Jan 2020
Inputs: rows 31, 33, 34, 35, 32, 67, 69, 70, 71, 68 (fact sheet rows)
Result: 3 months +0.9 pp; 6 months -4.2; year to date -4.8; 12 months -3.6; since Jan 2020 -6.5
The sign flips only in the 3-month window, which captures the July 2026 quarterly cost update in building PPIs and a 6.4% three-month drop in the energy component of inputs. Every longer window shows a squeeze.
Limitations: Short windows are sensitive to the quarterly step pattern of building PPIs and to preliminary data.
Squeeze history since December 2015
FormulaMonthly 12-month squeeze (WPU801 vs WPUIP231200), counted and ranked
Inputs: derived_metrics.csv rows sq_2015M12 to sq_2026M08, built from the WPU801 and WPUIP231200 monthly series (fact sheet rows)
Result: Negative in 63 of 129 months; current negative streak 16 months (since May 2025); trough -21.1 pp (June 2021); peak +17.2 pp (March 2023)
Squeezes are common and tend to reverse once building prices catch up with a cost shock, as in 2022 to 2023. The current episode is long but far shallower than 2021.
Limitations: Input-index history only reaches back to December 2014; the pattern is descriptive, not a forecast.
How the CB&C Margin Squeeze Index is defined
The index subtracts the growth in what nonresidential contractors pay from the growth in what BLS measures them charging for finished buildings. Below zero means costs are outrunning prices.
CB&C Margin Squeeze Index (MSI): MSI = 12-month % change in the BLS output PPI for a building type minus the 12-month % change in the BLS PPI for inputs to new nonresidential construction (WPUIP231200). Units are percentage points. A negative value means input prices rose faster than building prices.
Wage-weighted MSI: MSI_w = output change minus (0.60 x input change + 0.40 x change in average hourly earnings, nonresidential building construction). The 0.40 labor weight is a CB&C assumption, because the BLS input index excludes labor. We also report 0.30 and 0.50.
Output prices come from the BLS building-type PPIs for new industrial, warehouse, school, office and health care buildings, plus the commodity index for all new nonresidential building construction (WPU801). BLS builds these indexes from model buildings: material and installation costs are updated quarterly by a cost-estimating firm and combined with contractor margin data collected monthly (BLS factsheet).
Input prices come from the BLS inputs-to-industry indexes, which weight producer prices for the goods, energy and services an industry consumes and exclude capital investment, labor and imports (BLS). Labor comes from BLS Current Employment Statistics (CEU2023620003) and the Employment Cost Index.
Commercial construction costs 2026: the August index reading and ranking
In August 2026 every building type shows a negative reading. Offices are least squeezed, warehouses most.
For all new nonresidential buildings, the August 2026 reading is -3.6 points: building prices rose 5.3% in 12 months while inputs rose 8.9% (BLS inputs data). The AGC reports the same 8.9% input figure.
| Building type | Output PPI 12-mo % | Inputs to nonres. construction 12-mo % | Squeeze (pp) | Matched-input squeeze (pp) | Wage-weighted squeeze (pp) | Rank (1 = least squeezed) |
|---|---|---|---|---|---|---|
| Industrial buildings | +5.8 | +8.9 | -3.1 | -3.0 | -1.6 | 2 |
| Warehouses | +4.3 | +8.9 | -4.6 | -3.5 | -3.1 | 5 |
| Schools | +5.2 | +8.9 | -3.7 | -2.4 | -2.2 | 3 |
| Office buildings | +5.9 | +8.9 | -3.0 | -1.9 | -1.5 | 1 |
| Health care buildings | +5.0 | +8.9 | -3.9 | -2.9 | -2.4 | 4 |
| All new nonresidential buildings | +5.3 | +8.9 | -3.6 | -3.6 | -2.1 | – |
Squeeze = output 12-month % change minus input 12-month % change. Negative = input costs rose faster than prices for finished buildings. Wage-weighted variant uses a 0.40 labor weight on BLS average hourly earnings for nonresidential building construction. August 2026 values are preliminary.
Source: [1][2][3][5] U.S. Bureau of Labor Statistics; U.S. Bureau of Labor Statistics; U.S. Bureau of Labor Statistics; U.S. Bureau of Labor Statistics
Output price change minus input price change, percentage points
Source: CB&C calculation from U.S. Bureau of Labor Statistics PPI and CES data
Ranked from least to most squeezed: offices (-3.0 points), industrial buildings (-3.1), schools (-3.7), health care buildings (-3.9) and warehouses (-4.6). Against BLS's closer structure-type input indexes, the readings narrow to between -1.9 for offices and -3.5 for warehouses, because inputs to commercial, healthcare and educational structures rose 7.6% to 7.9%, less than the 8.9% for all nonresidential inputs.
With labor included at a 0.40 weight, the squeeze narrows to -2.1 points for all new nonresidential buildings, with a range of -1.5 for offices to -3.1 for warehouses. The 12-month sign would only turn positive with a labor weight of 0.97 or more, so the reading does not depend on the weight chosen.
Sensitivity check: does the squeeze survive other windows and weights?
The squeeze holds over 6 months, year to date and 12 months. It reverses only over 3 months, and over the full period since 2020 once labor is included.
| Window | Output PPI % | Inputs % | Wages % | Squeeze, materials only (pp) | Labor weight 0.30 (pp) | Labor weight 0.40 (pp) | Labor weight 0.50 (pp) |
|---|---|---|---|---|---|---|---|
| 3 months (May to Aug 2026) | +2.3 | +1.4 | +1.0 | +0.9 | +1.0 | +1.1 | +1.1 |
| 6 months (Feb to Aug 2026) | +2.4 | +6.6 | +1.5 | -4.2 | -2.7 | -2.2 | -1.6 |
| Year to date (Dec 2025 to Aug 2026) | +3.7 | +8.5 | +2.9 | -4.8 | -3.1 | -2.6 | -2.0 |
| 12 months (Aug 2025 to Aug 2026) | +5.3 | +8.9 | +5.2 | -3.6 | -2.5 | -2.1 | -1.8 |
| Since Jan 2020 | +46.3 | +52.8 | +32.3 | -6.5 | -0.3 | +1.7 | +3.8 |
Output = PPI new nonresidential building construction (WPU801). Inputs = PPI inputs to new nonresidential construction (WPUIP231200). Wages = average hourly earnings, nonresidential building construction (CEU2023620003). Changes are not annualized.
Source: [2][3][5] U.S. Bureau of Labor Statistics; U.S. Bureau of Labor Statistics; U.S. Bureau of Labor Statistics
Percentage points; negative means input costs outran building prices
Source: CB&C calculation from U.S. Bureau of Labor Statistics PPI and CES data
The 3-month window (May to August 2026) is the exception, at +0.9 points: building prices rose 2.3% while inputs rose 1.4%. Two things drive it. The building PPIs step up when quarterly cost data are refreshed, and July 2026 was such a month. The energy component of inputs also fell 6.4% over the same three months.
Over the full period since January 2020 the result depends on labor. On materials and services alone, inputs outran building prices by 6.5 points. Hourly earnings rose only 32.3%, so any labor weight above 0.32 turns the cumulative spread positive, reaching +1.7 points at 0.40.
Output PPI 12-month % change minus input PPI 12-month % change, quarter-end months plus August 2026
Source: CB&C calculation from U.S. Bureau of Labor Statistics PPI data (WPU801, WPUIP231200)
History puts the current reading in context. Since December 2015 the 12-month squeeze has been negative in 63 of 129 months. The low point was -21.1 in June 2021, during the pandemic materials spike. It then swung to +17.2 in March 2023 as building prices caught up. The current negative run began in May 2025 and is 16 months long, but it is much shallower than in 2021.
- Turner Building Cost Index: 1552 in Q2 2026, up 1.44% from Q1 2026 and 5.15% from Q2 2025 (Turner).
- Rider Levett Bucknall national index: 288.58 in Q2 2026, up from 285.47 in Q1 2026, a 1.1% quarterly rise (RLB).
- Mortenson Construction Cost Index: +1.58% for the quarter and +5.60% over 12 months, with materials +6.0% and trade partner work +5.2% over 12 months (Mortenson).
- JLL: final-cost indexes running roughly 5% year over year in mid-2026 (JLL).
These private indexes measure finished-building costs, like the BLS output PPIs, and cluster between roughly 5% and 5.60%, near the 5.3% BLS reading. None of them reaches the 8.9% rise in BLS input prices, which is consistent with the squeeze.
Component 1: output prices for new nonresidential buildings by type
Finished-building prices rose 4.3% to 5.9% by type in the 12 months to August 2026, with most of the 2026 gain arriving in January and July.
| Series | BLS ID | Index, Aug 2026 | 12-mo % | 3-mo % | Dec 2025 to Aug 2026 % | Since Jan 2020 % |
|---|---|---|---|---|---|---|
| Industrial buildings | PCU236211236211 | 205.766 | +5.8 | +2.4 | +3.5 | +49.0 |
| Warehouses | PCU236221236221 | 244.797 | +4.3 | +2.2 | +3.2 | +50.6 |
| Schools | PCU236222236222 | 242.658 | +5.2 | +2.2 | +3.8 | +40.0 |
| Office buildings | PCU236223236223 | 224.354 | +5.9 | +2.5 | +3.5 | +54.4 |
| Health care buildings | PCU236224236224 | 167.792 | +5.0 | +2.4 | +4.3 | +41.5 |
| All new nonresidential buildings | WPU801 | 186.149 | +5.3 | +2.3 | +3.7 | +46.3 |
| Concrete contractors, nonres. building work | PCU23811X23811X | 197.19 | +5.6 | +1.6 | +4.7 | +43.5 |
| Roofing contractors, nonres. building work | PCU23816X23816X | 232.226 | +5.7 | +1.8 | +3.4 | +66.5 |
| Electrical contractors, nonres. building work | PCU23821X23821X | 180.69 | +5.3 | +1.4 | +3.0 | +39.1 |
| Plumbing and HVAC contractors, nonres. building work | PCU23822X23822X | 187.229 | +4.0 | +2.9 | +3.8 | +34.9 |
| Final demand construction | WPUFD43 | 188.083 | +5.3 | +2.3 | +3.7 | +45.1 |
BLS Producer Price Indexes, not seasonally adjusted. Building-type indexes combine quarterly-updated material and installation costs with monthly contractor margin data. August 2026 values are preliminary.
Source: [1][2][4][9] U.S. Bureau of Labor Statistics; U.S. Bureau of Labor Statistics; U.S. Bureau of Labor Statistics; U.S. Bureau of Labor Statistics
BLS Producer Price Indexes, not seasonally adjusted, January and July readings plus August 2026
Source: U.S. Bureau of Labor Statistics, Producer Price Indexes (August 2026 release, Sept. 10, 2026); CB&C rebasing
From December 2025 to August 2026, prices for all new nonresidential buildings rose 3.7%, led by health care buildings at 4.3%. Since January 2020, office building prices are up 54.4% and school prices 40.0%. Among specialty trades on nonresidential work, roofing contractors' prices are up 66.5% since January 2020 and plumbing and HVAC contractors' prices 34.9%.
The final demand construction index (WPUFD43), which BLS uses in its headline release, also rose 5.3% over the year. For context, the all-economy PPI for final demand rose 5.4% unadjusted over the same 12 months (BLS PPI release). Owners comparing quotes per square foot can read these trends alongside our planned guide to commercial construction cost per square foot.
Component 2: material and energy input prices
Input costs are being pushed by energy and metals. Concrete, gypsum and glass are close to flat.
| Series | BLS ID | Index, Aug 2026 | 12-mo % | 3-mo % | Since Jan 2020 % |
|---|---|---|---|---|---|
| Inputs to new nonresidential construction | WPUIP231200 | 168.275 | +8.9 | +1.4 | +52.8 |
| Inputs to nonres. construction: goods | WPUIP2312001 | 180.686 | +8.8 | +0.7 | +55.5 |
| Inputs to nonres. construction: services | WPUIP2312002 | 166.88 | +9.4 | +3.2 | +46.0 |
| Inputs to nonres. construction: energy | WPUIP23120012 | 184.831 | +49.7 | -6.4 | +99.4 |
| Inputs to commercial structures | WPUIP231211 | 169.988 | +7.8 | +1.4 | +53.3 |
| Inputs to healthcare structures | WPUIP231212 | 169.279 | +7.9 | +1.4 | +53.1 |
| Inputs to industrial structures | WPUIP231220 | 170.111 | +8.8 | +1.2 | +52.6 |
| Inputs to educational and vocational structures | WPUIP231233 | 168 | +7.6 | +1.2 | +51.8 |
BLS inputs-to-industry indexes exclude capital investment, labor and imports. August 2026 values are preliminary.
Source: [3] U.S. Bureau of Labor Statistics
| Rank | Material | BLS ID | Index, Aug 2026 | 12-mo % | 3-mo % | Since Jan 2020 % |
|---|---|---|---|---|---|---|
| 1 | Diesel fuel (No. 2) | WPU057303 | 546.035 | +77.8 | -6.1 | +154.6 |
| 2 | Aluminum mill shapes | WPU102501 | 370.902 | +27.3 | -3.7 | +92.9 |
| 3 | Copper wire and cable | WPU10260314 | 602.48 | +27.2 | +6.7 | +99.4 |
| 4 | Steel mill products | WPU1017 | 381.162 | +23.4 | +8.9 | +103.5 |
| 5 | Copper and brass mill shapes | WPU102502 | 813.325 | +20.9 | +0.4 | +107.1 |
| 6 | Asphalt (refinery) | WPU058102 | 295.296 | +16.4 | +8.4 | +53.0 |
| 7 | Hot rolled bars, plates, structural shapes | WPU101704 | 312.467 | +13.4 | +5.6 | +65.3 |
| 8 | Switchgear and industrial controls | WPU1175 | 430.247 | +12.3 | +4.1 | +82.9 |
| 9 | Softwood lumber | WPU0811 | 294.899 | +11.8 | +3.7 | +33.3 |
| 10 | Transformers and power regulators | WPU1174 | 434.493 | +7.6 | +4.2 | +84.2 |
| 11 | Concrete block and brick | WPU1331 | 408.992 | +3.4 | +0.0 | +50.1 |
| 12 | Fabricated structural metal | WPU107405 | 369.823 | +3.1 | +3.4 | +62.9 |
| 13 | Flat glass | WPU1311 | 184.181 | +2.8 | +0.0 | +33.6 |
| 14 | Ready-mix concrete | WPU1333 | 395.186 | +2.3 | +0.3 | +40.3 |
| 15 | Insulation materials | WPU1392 | 289.038 | +1.1 | -0.2 | +49.5 |
| 16 | Gypsum products | WPU1371 | 484.844 | +0.2 | +2.1 | +48.0 |
BLS commodity PPIs, not seasonally adjusted, domestic producer prices. Ranked by 12-month change. August 2026 values are preliminary.
Source: [4] U.S. Bureau of Labor Statistics
BLS commodity PPIs, percent
Source: U.S. Bureau of Labor Statistics, Producer Price Indexes (August 2026, preliminary)
Inside the 8.9% rise in nonresidential inputs, the energy component rose 49.7%, goods 8.8% and services 9.4% in the 12 months to August 2026. Diesel fuel (+77.8%) and refinery asphalt (+16.4%) carry the energy shock; the ABC analysis of the same data puts nonresidential input prices up 8.8%.
Metals sit under Section 232 tariffs. Proclamation 10947 raised steel and aluminum tariffs from 25% to 50% effective June 4, 2025 (Federal Register). Proclamation 10962 set a 50% tariff on semi-finished copper products effective Aug. 1, 2025 (Federal Register). Proclamation 11021 set full-value tariffs on aluminum, steel and certain copper articles at 50%, with certain other copper articles and derivatives generally at 25%, effective April 6, 2026 (Federal Register).
The price data show that steel mill products have risen 16.7% since May 2025 and 15.0% since March 2026. Aluminum mill shapes are up 44.3% since May 2025, and copper wire and cable 22.9% since July 2025. These are price moves after the effective dates, not measured tariff effects; energy costs, demand from data center and grid work, and exchange rates also move these series.
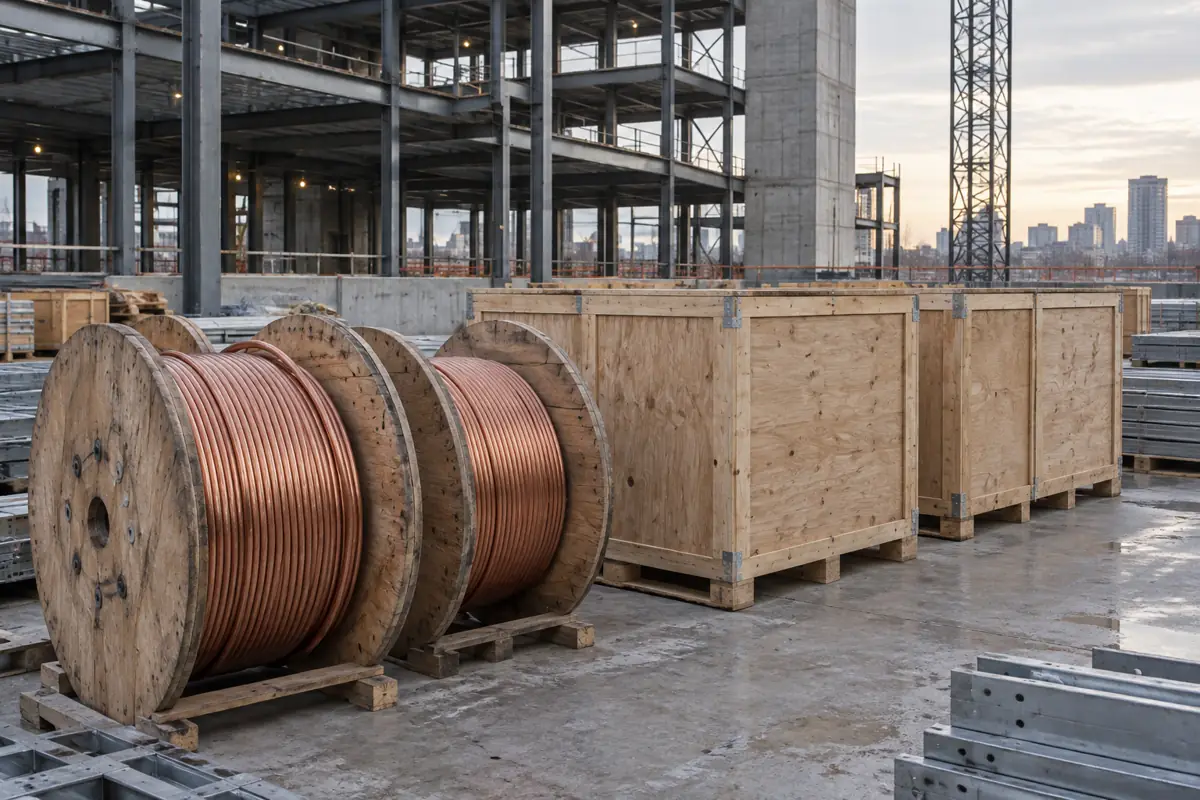
Electrical gear is also running hot: switchgear and industrial controls rose 12.3% and transformers 7.6% over the year, and since January 2020 they are up 82.9% and 84.2%. Fabricated structural metal (shop-fabricated steel) rose only 3.1% over 12 months despite the 23.4% rise in mill steel.
Component 3: labor cost
Construction wages are rising faster than the private sector, but about as fast as building prices. Labor explains little of the 2026 squeeze.
| Measure | BLS ID | Latest level | Period | 12-mo % | Cumulative % |
|---|---|---|---|---|---|
| Avg. hourly earnings, nonresidential building construction | CEU2023620003 | $47.35 | Aug 2026 | +5.2 | +32.3 (since Jan 2020) |
| Avg. hourly earnings, specialty trade contractors | CEU2023800003 | $40.50 | Aug 2026 | +5.0 | +34.5 (since Jan 2020) |
| ECI wages and salaries, private construction | CIU2022300000000I | 174.584 | Q2 2026 | +3.5 | +26.5 (since Q1 2020) |
| ECI total compensation, private construction | CIU2012300000000I | 171.203 | Q2 2026 | +3.5 | +24.4 (since Q1 2020) |
CES earnings are not seasonally adjusted, all employees; August 2026 is preliminary. ECI index December 2005 = 100.
Source: [5][6] U.S. Bureau of Labor Statistics; U.S. Bureau of Labor Statistics
All new nonresidential buildings
Source: U.S. Bureau of Labor Statistics, PPI and Current Employment Statistics; CB&C rebasing
Average hourly earnings in nonresidential building construction reached $47.35 in August 2026, up 5.2% on the year; specialty trade contractors averaged $40.50, up 5.0%. AGC notes that the production and nonsupervisory measure for all construction rose 5.0%, against 3.3% for the private sector (AGC).
The Employment Cost Index, which holds job mix constant, shows slower growth. Construction wages and salaries rose 3.5% from Q2 2025 to Q2 2026, and total compensation rose 3.5%. The Q3 2026 ECI is due Oct. 30, 2026.
What the readings mean for owners and contractors
The data describe a squeeze on contractor spreads driven by metals and energy, not by labor. How it is shared depends on contract terms.
- For owners, the 5.3% rise in building prices to August 2026 is the measured price trend. The 8.9% rise in inputs is pressure that has not yet fully reached bids.
- Past squeezes closed through rising building prices, as in 2022 to 2023 when the spread swung from -21.1 to +17.2 points. The history describes that pattern; it does not forecast it.
- Exposure differs by trade package. Steel, copper, aluminum, switchgear and diesel-heavy sitework carry the most price movement. Concrete, gypsum, glass and insulation carry the least.
- In the AGC's July to August 2026 survey, 55% of respondents reported projects canceled, postponed or scaled back in the past six months.
Readers comparing contractor proposals can see how escalation clauses and allowances show up in pricing in our guide on how to compare construction bids. Spending volumes are covered separately in commercial construction spending.
Key findings
- The BLS PPI for new nonresidential building construction (WPU801) rose 5.3% from August 2025 to August 2026 in the United States.[2]
- The BLS PPI for inputs to new nonresidential construction (WPUIP231200) rose 8.9% from August 2025 to August 2026.[3][18]
- The CB&C Margin Squeeze Index for all new nonresidential buildings was -3.6 percentage points in August 2026, the 16th straight negative month since May 2025.[2][3]
- New office building prices rose 5.9% in the 12 months to August 2026, the fastest of the five BLS building types.[1]
- New warehouse building prices rose 4.3% in the 12 months to August 2026, the slowest of the five building types, giving warehouses the deepest squeeze at -4.6 points.[1][3]
- Average hourly earnings of all employees in nonresidential building construction were $47.35 in August 2026 (preliminary), up 5.2% from August 2025.[5]
- The ECI for wages and salaries of private construction workers rose 3.5% from Q2 2025 to Q2 2026.[6]
- The PPI for No. 2 diesel fuel rose 77.8% in the 12 months to August 2026, the largest increase among 16 construction material and energy series tracked here.[4][18]
- Steel mill product prices rose 23.4%, aluminum mill shapes 27.3% and copper wire and cable 27.2% in the 12 months to August 2026.[4][18]
- Ready-mix concrete prices rose 2.3% and gypsum product prices 0.2% in the 12 months to August 2026.[4]
- Since January 2020, new nonresidential building prices have risen 46.3%, inputs to new nonresidential construction 52.8% and nonresidential building hourly earnings 32.3%.[2][3][5]
- Over the 3 months from May to August 2026, building prices rose 2.3% while inputs rose 1.4%, the only window in which the squeeze turns positive (+0.9 points).[2][3]
- Private cost indexes point the same way on building costs: Turner's Building Cost Index rose 5.15% year over year in Q2 2026 and Mortenson's index 5.60% over 12 months.[19][21]
Summary for decision makers
- BLS output prices for new nonresidential buildings rose 5.3% from August 2025 to August 2026; by type, offices rose 5.9%, industrial buildings 5.8%, schools 5.2%, health care buildings 5.0% and warehouses 4.3%.
- BLS prices for inputs to new nonresidential construction rose 8.9% over the same 12 months, so the CB&C Margin Squeeze Index for all new nonresidential buildings reads -3.6 percentage points in August 2026.
- Every building type is in squeeze territory; warehouses show the deepest reading at -4.6 points and offices the shallowest at -3.0 points.
- Labor is not the main pressure: average hourly earnings in nonresidential building construction rose 5.2% in the year to August 2026, close to the 5.3% rise in building prices.
- The squeeze sign flips to +0.9 points only in the 3-month window (May to August 2026), when the July 2026 quarterly cost update lifted building prices 2.3%; the 6-month, year-to-date and 12-month windows all stay negative.
- The heat is concentrated in energy and metals: diesel fuel rose 77.8%, aluminum mill shapes 27.3%, copper wire and cable 27.2% and steel mill products 23.4% in the 12 months to August 2026, while ready-mix concrete rose 2.3% and gypsum products 0.2%.
- Since January 2020, new nonresidential building prices are up 46.3%, inputs 52.8% and hourly earnings 32.3%; with a 0.40 labor weight, the cumulative spread is +1.7 points in contractors' favor.
Questions people ask
Are construction costs going down in 2026?
No. BLS prices for new nonresidential buildings rose 3.7% from December 2025 to August 2026, and inputs to new nonresidential construction rose 8.5% over the same period. Among 16 material series, none fell over the 12 months to August 2026; gypsum products were the flattest at +0.2%.
How much have construction costs increased since 2020?
From January 2020 to August 2026, BLS prices for new nonresidential buildings rose 46.3% and inputs to new nonresidential construction rose 52.8%. By type, the rise runs from 40.0% for schools to 54.4% for offices. Hourly earnings in nonresidential building construction rose 32.3%.
Which construction materials are rising the fastest?
In the 12 months to August 2026, diesel fuel rose 77.8%, aluminum mill shapes 27.3%, copper wire and cable 27.2%, steel mill products 23.4% and copper and brass mill shapes 20.9% (BLS PPI). Ready-mix concrete rose 2.3% and gypsum products 0.2%.
Why are commercial construction bids so high?
Bids reflect input costs that have risen sharply. BLS inputs to new nonresidential construction rose 8.9% in the year to August 2026, led by a 49.7% rise in the energy component and double-digit gains in steel, aluminum and copper. Wages rose 5.2%. Measured building prices rose 5.3%, less than inputs, so bids have not fully absorbed the cost increase.
Are steel prices up in 2026?
Yes. The BLS PPI for steel mill products rose 22.0% from December 2025 to August 2026 and 23.4% from August 2025 to August 2026. Hot rolled bars, plates and structural shapes rose 13.4% over 12 months. Fabricated structural metal rose only 3.1%.
For journalists and researchers
If you cite only a few, cite these
- New nonresidential building prices +5.3% vs contractor input prices +8.9%, 12 months to August 2026 (BLS PPI).[2][3]
- CB&C Margin Squeeze Index: -3.6 points in August 2026; warehouses -4.6, offices -3.0.[1][2][3]
- Steel mill products +23.4%, copper wire and cable +27.2%, ready-mix concrete +2.3%, 12 months to August 2026 (BLS PPI).[4]
Most quotable statistics
- Prices for new nonresidential buildings rose 5.3% in the 12 months to August 2026, while the inputs contractors buy rose 8.9% (BLS PPI).[2][3]
- The CB&C Margin Squeeze Index read -3.6 points in August 2026, its 16th straight negative month.[2][3]
- Warehouses are the most squeezed building type: prices up 4.3% against inputs up 8.9% in the year to August 2026.[1][3]
- Diesel fuel producer prices rose 77.8% and aluminum mill shapes 27.3% in the 12 months to August 2026.[4]
- Nonresidential building wages rose 5.2% in the year to August 2026, roughly matching the 5.3% rise in building prices.[5][2]
- Since January 2020, U.S. new nonresidential building prices are up 46.3% and hourly earnings in nonresidential building construction 32.3%.[2][5]
Press summary
Prices that U.S. contractors charge for new nonresidential buildings rose 5.3% in the 12 months to August 2026, while the goods, energy and services they buy rose 8.9%, according to a Commercial Builders & Contractors analysis of Bureau of Labor Statistics producer price data released Sept. 10, 2026. The resulting CB&C Margin Squeeze Index reads -3.6 percentage points, its 16th consecutive negative month. Every building type is affected: warehouses show the deepest squeeze at -4.6 points, offices the shallowest at -3.0. Energy and metals drive the gap, with diesel fuel up 77.8%, aluminum mill shapes 27.3%, copper wire and cable 27.2% and steel mill products 23.4%. Labor is not the main pressure: hourly earnings in nonresidential building construction rose 5.2%, close to building prices. The squeeze reverses only in a 3-month window that captures a quarterly cost update. All data, formulas and CSV files are published under CC BY 4.0.
Suggested headlines
- Contractor input costs up 8.9%, building prices up 5.3%: the 2026 margin squeeze in BLS data
- Warehouses face the deepest margin squeeze of any building type in 2026
- Diesel, aluminum and copper lead construction material price gains to August 2026
- Construction wages keep pace with building prices; metals and energy do not
- 16 months and counting: nonresidential construction's input-cost squeeze
How to cite this report
Commercial Builders & Contractors. (2026). Commercial Construction Costs 2026: The CB&C Margin Squeeze Index. Retrieved from https://commercialbuildersandcontractors.com/commercial-construction-price-index/
Reuse license
Data and tables are licensed CC BY 4.0. Attribution: “Source: Commercial Builders & Contractors, Commercial Construction Costs 2026: The CB&C Margin Squeeze Index” with a link to this page.
Download the data
Every table in this report is available as a CSV under CC BY 4.0. The fact sheet lists each value with its source URL and access date.
- derived_metrics.csv (CSV)
- fact_sheet.csv (CSV)
- CB&C Margin Squeeze Index by building type, 12 months to August 2026 (CSV)
- Sensitivity check: does the squeeze sign change with the window or the labor weight? All new nonresidential buildings (CSV)
- Output prices: what contractors charge for new nonresidential buildings, August 2026 (CSV)
- Input prices: what nonresidential contractors pay for goods, energy and services, August 2026 (CSV)
- Material heat ranking: 12-month producer price change, August 2026 (CSV)
- Labor cost: construction wages and compensation (CSV)
Frequently asked questions
What is the CB&C Margin Squeeze Index?
It is the 12-month % change in the BLS output PPI for a nonresidential building type minus the 12-month % change in the BLS PPI for inputs to new nonresidential construction. In August 2026 it read -3.6 points for all new nonresidential buildings.
Which building type had the fastest price increase in the year to August 2026?
New office buildings, at 5.9%, followed by industrial buildings at 5.8%, schools at 5.2%, health care buildings at 5.0% and warehouses at 4.3% (BLS PPI, United States).
How much did construction input prices rise in the 12 months to August 2026?
The BLS PPI for inputs to new nonresidential construction rose 8.9%. ABC's analysis of BLS data puts nonresidential input prices up 8.8% over the same period.
How fast are construction wages rising?
Average hourly earnings in nonresidential building construction rose 5.2% from August 2025 to August 2026, to $47.35. The ECI for private construction wages and salaries rose 3.5% from Q2 2025 to Q2 2026.
Did copper prices rise in 2026?
Yes. The BLS PPI for copper wire and cable rose 18.0% from December 2025 to August 2026 and 27.2% over 12 months. Copper and brass mill shapes rose 20.9% over 12 months.
What tariffs apply to construction metals in 2026?
Proclamation 11021 set full-value Section 232 tariffs on aluminum, steel and certain copper articles at 50%, with certain copper articles and derivatives generally at 25%, effective April 6, 2026 (Federal Register).
Is the margin squeeze new?
No. Since December 2015 the 12-month squeeze has been negative in 63 of 129 months. The current negative run started in May 2025 and has lasted 16 months to August 2026.
Do private cost indexes agree with BLS?
Broadly. Turner's index rose 5.15% year over year in Q2 2026, Mortenson's 5.60% over 12 months and JLL cites roughly 5%, close to the 5.3% BLS output reading.
Why do building PPIs jump in January, April, July and October?
BLS combines material and installation cost data that a cost-estimating firm updates quarterly with monthly contractor margin data, so quarterly updates create steps.
When is the next data update?
BLS is scheduled to publish September 2026 PPI data on Oct. 15, 2026 and the Q3 2026 Employment Cost Index on Oct. 30, 2026.
Methodology
Source selection: all index figures come from BLS flat files downloaded on Oct. 3, 2026 (PPI industry and commodity files, the inputs-to-construction file, CES construction earnings and the ECI). Tariff facts come from proclamations published in the Federal Register. Private cost indexes (Turner, Rider Levett Bucknall, Mortenson, JLL) and trade association analyses (ABC, AGC) are cited for their published headline figures only and are used as cross-checks, not inputs.
Inclusion and exclusion: we used not seasonally adjusted series so that 12-month comparisons match BLS's unadjusted headline convention and building PPIs, which are published unadjusted. August 2026 PPI and CES values are preliminary. Materials were chosen for their weight in commercial building packages: structural and mill steel, concrete, masonry, gypsum, copper, aluminum, lumber, asphalt, glass, insulation and electrical gear. Third-party tables and charts were not reproduced. A press page from the Urban Land Institute ranked for the target keyword but could not be opened (security challenge), so it is not cited.
Conflicting numbers: ABC reports nonresidential input prices up 8.8% (its goods-based measure) while CB&C uses the goods-and-services index at 8.9%, which AGC also reports. Both are shown. The AGC 16.4% figure for liquid asphalt matches the BLS asphalt series (WPU058102); the broader asphalt and other petroleum products group was not used. Mortenson's release is titled 3rd Quarter 2026 but refers to second-quarter pricing; we cite it by release date.
Derived metrics: each percentage change is (later index / earlier index – 1) x 100, rounded to one decimal. Squeeze readings subtract rounded input changes from rounded output changes. The wage-weighted variant blends input and earnings changes with labor weights of 0.30, 0.40 and 0.50, which are assumptions. Every formula, input row and result is in derived_metrics.csv; scripts in the scripts folder reproduce all figures from the raw files.
Limitations: BLS building PPIs are model-based and include modeled costs plus margin, so the index measures spread compression rather than profit. The input index excludes labor and imports, so import prices affected by tariffs enter only through domestic producer prices. Hourly earnings exclude benefits and shift with job mix. Results are national; regional indexes exist but are not analyzed here.
Last updated Oct. 3, 2026 with August 2026 PPI data (released Sept. 10, 2026). The next scheduled update follows the Oct. 15, 2026 PPI release.
This report presents published data with its limitations. It is not legal, financial or investment advice.
Sources, ranked by quality
Tier 1: primary and official sources (16)
- [1] U.S. Bureau of Labor Statistics. PPI industry data for construction (pc.data.75.Construction flat file). June 2006 to August 2026. Accessed 2026-10-03.
- [2] U.S. Bureau of Labor Statistics. PPI commodity data for construction, incl. WPU801 and WPUFD43 (wp.data.80.Construction flat file). to August 2026. Accessed 2026-10-03.
- [3] U.S. Bureau of Labor Statistics. PPI inputs to construction industries (wp.data.80i.ConstructnInputs flat file). December 2014 to August 2026. Accessed 2026-10-03.
- [4] U.S. Bureau of Labor Statistics. PPI commodity data, current year file (wp.data.0.Current). to August 2026. Accessed 2026-10-03.
- [5] U.S. Bureau of Labor Statistics. Current Employment Statistics, construction hours and earnings (ce.data.20b flat file). to August 2026 (NAICS 2362). Accessed 2026-10-03.
- [6] U.S. Bureau of Labor Statistics. Employment Cost Index, current data (ci.data.0.Current flat file). to Q2 2026. Accessed 2026-10-03.
- [7] U.S. Bureau of Labor Statistics. Producer Price Indexes, August 2026 (news release USDL 26-1495). August 2026. Accessed 2026-10-03.
- [8] U.S. Bureau of Labor Statistics. PPI release schedule. 2026. Accessed 2026-10-03.
- [9] U.S. Bureau of Labor Statistics. PPI factsheet: New Office Building Construction, NAICS 236223. methodology, modified Sept. 16, 2025. Accessed 2026-10-03.
- [10] U.S. Bureau of Labor Statistics. Inputs to Industry Price Indexes. methodology. Accessed 2026-10-03.
- [11] Federal Register (via govinfo.gov). Proclamation 10947, Adjusting Imports of Aluminum and Steel Into the United States. June 3, 2025. Accessed 2026-10-03.
- [12] Federal Register (via govinfo.gov). Proclamation 10962, Adjusting Imports of Copper Into the United States. July 30, 2025. Accessed 2026-10-03.
- [13] Federal Register (via govinfo.gov). Proclamation 11012, Imposing a Temporary Import Surcharge. February 20, 2026. Accessed 2026-10-03.
- [14] Federal Register (via govinfo.gov). Proclamation 11021, Strengthening Actions Taken To Adjust Imports of Aluminum, Steel, and Copper. April 2, 2026. Accessed 2026-10-03.
- [15] U.S. Bureau of Labor Statistics. Employment Cost Index release schedule. 2025 to 2026. Accessed 2026-10-03.
- [16] U.S. Bureau of Labor Statistics. Employment Situation release schedule. 2025 to 2026. Accessed 2026-10-03.
Tier 2: trade bodies, market research, company data (6)
- [17] Associated Builders and Contractors. ABC: Construction Materials Prices Jump Again in August. August 2026. Accessed 2026-10-03.
- [18] Associated General Contractors of America. Construction Input Costs Climb 8.9% Between August 2025 And August 2026. August 2026. Accessed 2026-10-03.
- [19] Turner Construction Company. Second Quarter 2026 Turner Building Cost Index. Q2 2026. Accessed 2026-10-03.
- [20] Rider Levett Bucknall. RLB Construction Cost Report North America Q2 2026. Q2 2026. Accessed 2026-10-03.
- [21] Mortenson. Construction Cost Index: 3rd Quarter 2026. release of Sept. 8, 2026. Accessed 2026-10-03.
- [22] JLL. JLL report details rising construction costs in 2026. mid-2026. Accessed 2026-10-03.