
Construction GDP by State: Share of Each Economy, Real Growth and Output per Worker, 2025
- Primary data
- BEA GDP by state and industry: SAGDP2, SAGDP9, SQGDP2, SQGDP9, construction (NAICS 23)
- Data period
- Annual 1997 to 2025; quarterly through 2026 Q2
- Latest release used
- 2026-09-30
- Next release
- 2026-12-23 (third quarter 2026 state GDP)
- Geography
- 50 states and the District of Columbia
- Sources
- 20 (17 Tier 1)
Construction GDP by state totaled $1.34 trillion across the US in 2025, 4.3% of GDP (BEA). California ($152.9 billion), Texas and Florida are largest. Utah (7.8%) and Nevada (7.7%) depend on construction most. In real terms Idaho grew fastest from 2019 to 2025 (+36.4%), while US real construction output fell 2.1%.
All 50 states and DC: construction value added, 2025
California ($152.9 billion), Texas ($142.8 billion) and Florida ($99.1 billion) together account for 29.5% of US construction value added. Per resident, Utah and Nevada lead.
Show all 52 rows
| State | Construction GDP 2025 ($ millions) | All-industry GDP 2025 ($ millions) | Construction share 2025 (%) | Share rank (of 51) | Construction share 2019 (%) | Change in share 2019 to 2025 (points) | Construction GDP per resident 2025 ($) | Share of US construction GDP (%) |
|---|---|---|---|---|---|---|---|---|
| Utah | 24,994.6 | 319,178.6 | 7.83 | 1 | 6.92 | 0.91 | 7,063 | 1.87 |
| Nevada | 21,733.4 | 281,376.7 | 7.72 | 2 | 7.54 | 0.18 | 6,622 | 1.62 |
| Idaho | 9,126.1 | 137,401.9 | 6.64 | 3 | 5.52 | 1.13 | 4,496 | 0.68 |
| Montana | 5,111.0 | 80,945.2 | 6.31 | 4 | 5.73 | 0.59 | 4,465 | 0.38 |
| Arizona | 37,331.5 | 592,103.0 | 6.30 | 5 | 5.28 | 1.03 | 4,897 | 2.79 |
| Wyoming | 3,289.7 | 52,491.2 | 6.27 | 6 | 6.07 | 0.20 | 5,588 | 0.25 |
| Louisiana | 20,700.4 | 342,321.2 | 6.05 | 7 | 6.30 | -0.25 | 4,482 | 1.54 |
| Hawaii | 7,344.6 | 123,163.8 | 5.96 | 8 | 6.02 | -0.06 | 5,126 | 0.55 |
| Maryland | 33,232.6 | 567,018.5 | 5.86 | 9 | 6.17 | -0.31 | 5,304 | 2.48 |
| Colorado | 32,657.1 | 574,863.9 | 5.68 | 10 | 6.19 | -0.51 | 5,431 | 2.44 |
| North Dakota | 4,595.7 | 82,349.8 | 5.58 | 11 | 5.57 | 0.01 | 5,749 | 0.34 |
| South Carolina | 20,938.3 | 378,383.0 | 5.53 | 12 | 5.31 | 0.22 | 3,759 | 1.56 |
| Alaska | 4,071.0 | 73,634.8 | 5.53 | 13 | 5.07 | 0.46 | 5,522 | 0.30 |
| Florida | 99,130.0 | 1,805,620.2 | 5.49 | 14 | 5.65 | -0.16 | 4,225 | 7.40 |
| Indiana | 28,305.2 | 542,457.6 | 5.22 | 15 | 4.67 | 0.55 | 4,059 | 2.11 |
| Georgia | 47,478.9 | 936,086.7 | 5.07 | 16 | 4.78 | 0.29 | 4,201 | 3.54 |
| Minnesota | 25,996.3 | 515,116.4 | 5.05 | 17 | 4.77 | 0.27 | 4,459 | 1.94 |
| Virginia | 39,347.9 | 807,925.0 | 4.87 | 18 | 4.62 | 0.25 | 4,431 | 2.94 |
| Texas | 142,793.2 | 2,932,343.6 | 4.87 | 19 | 5.24 | -0.37 | 4,503 | 10.66 |
| Oregon | 16,587.8 | 343,240.2 | 4.83 | 20 | 4.88 | -0.04 | 3,881 | 1.24 |
| Alabama | 16,294.5 | 339,035.1 | 4.81 | 21 | 4.52 | 0.29 | 3,138 | 1.22 |
| North Carolina | 42,875.8 | 895,919.2 | 4.79 | 22 | 4.56 | 0.22 | 3,829 | 3.20 |
| Missouri | 22,640.3 | 475,377.3 | 4.76 | 23 | 4.44 | 0.33 | 3,611 | 1.69 |
| Nebraska | 9,635.0 | 206,616.2 | 4.66 | 24 | 4.43 | 0.23 | 4,775 | 0.72 |
| Kansas | 10,692.5 | 232,106.7 | 4.61 | 25 | 4.14 | 0.46 | 3,591 | 0.80 |
| Wisconsin | 21,858.1 | 478,781.2 | 4.57 | 26 | 4.33 | 0.23 | 3,660 | 1.63 |
| Iowa | 12,342.3 | 271,937.2 | 4.54 | 27 | 4.61 | -0.07 | 3,811 | 0.92 |
| New Mexico | 6,689.8 | 152,120.0 | 4.40 | 28 | 4.30 | 0.10 | 3,147 | 0.50 |
| South Dakota | 3,540.3 | 82,001.9 | 4.32 | 29 | 4.11 | 0.20 | 3,786 | 0.26 |
| Arkansas | 8,457.5 | 195,988.2 | 4.32 | 30 | 3.96 | 0.36 | 2,715 | 0.63 |
| West Virginia | 4,723.0 | 111,302.3 | 4.24 | 31 | 5.13 | -0.88 | 2,674 | 0.35 |
| Ohio | 40,876.4 | 976,871.7 | 4.18 | 32 | 3.93 | 0.25 | 3,435 | 3.05 |
| Michigan | 30,594.2 | 733,887.1 | 4.17 | 33 | 3.68 | 0.49 | 3,021 | 2.28 |
| Tennessee | 24,261.6 | 586,210.1 | 4.14 | 34 | 3.70 | 0.44 | 3,317 | 1.81 |
| Pennsylvania | 42,393.8 | 1,056,488.2 | 4.01 | 35 | 4.13 | -0.11 | 3,246 | 3.16 |
| Kentucky | 12,392.8 | 313,566.3 | 3.95 | 36 | 3.93 | 0.02 | 2,690 | 0.92 |
| Oklahoma | 10,809.7 | 274,292.2 | 3.94 | 37 | 3.85 | 0.09 | 2,622 | 0.81 |
| Washington | 35,156.8 | 892,254.8 | 3.94 | 38 | 4.46 | -0.52 | 4,394 | 2.62 |
| Rhode Island | 3,334.7 | 88,240.6 | 3.78 | 39 | 3.99 | -0.21 | 2,992 | 0.25 |
| Maine | 3,803.4 | 101,726.2 | 3.74 | 40 | 3.54 | 0.20 | 2,688 | 0.28 |
| Mississippi | 6,076.2 | 162,824.8 | 3.73 | 41 | 3.40 | 0.33 | 2,057 | 0.45 |
| Massachusetts | 29,567.2 | 813,590.5 | 3.63 | 42 | 4.06 | -0.43 | 4,133 | 2.21 |
| Vermont | 1,787.8 | 49,657.5 | 3.60 | 43 | 3.57 | 0.03 | 2,773 | 0.13 |
| California | 152,893.5 | 4,297,449.8 | 3.56 | 44 | 4.20 | -0.64 | 3,885 | 11.41 |
| Illinois | 42,521.5 | 1,240,982.7 | 3.43 | 45 | 3.53 | -0.11 | 3,343 | 3.17 |
| New Jersey | 29,935.9 | 887,793.1 | 3.37 | 46 | 3.57 | -0.20 | 3,135 | 2.23 |
| Delaware | 3,999.7 | 121,940.0 | 3.28 | 47 | 3.76 | -0.48 | 3,773 | 0.30 |
| New Hampshire | 4,133.3 | 128,278.6 | 3.22 | 48 | 3.30 | -0.08 | 2,920 | 0.31 |
| Connecticut | 10,647.8 | 382,595.5 | 2.78 | 49 | 2.82 | -0.04 | 2,887 | 0.79 |
| New York | 68,345.4 | 2,465,749.3 | 2.77 | 50 | 3.27 | -0.50 | 3,417 | 5.10 |
| District of Columbia | 1,970.4 | 192,975.4 | 1.02 | 51 | 1.33 | -0.31 | 2,841 | 0.15 |
| United States | 1,340,017.0 | 30,861,292.0 | 4.34 | 4.42 | -0.08 | 3,921 |
Current dollars, BEA SAGDP2 line 11 (construction, NAICS 23) and line 1 (all-industry total), annual update of September 30, 2026. Share of US construction GDP uses the sum of the 50 states and DC as the base. Population: Census Vintage 2025.
Source: [1][15] U.S. Bureau of Economic Analysis; U.S. Census Bureau
Ranked by dollars, the ten largest construction economies in 2025 were California ($152.9 billion), Texas ($142.8 billion), Florida ($99.1 billion), New York ($68.3 billion), Georgia ($47.5 billion), North Carolina ($42.9 billion), Illinois ($42.5 billion), Pennsylvania ($42.4 billion), Ohio ($40.9 billion), Virginia ($39.3 billion). Vermont ($1.8 billion) and the District of Columbia ($2.0 billion) were smallest.
Per resident, construction value added was $3,921 in the US in 2025 (Census Vintage 2025 population). It was highest in Utah ($7,063), Nevada ($6,622) and North Dakota ($5,749), and lowest in Mississippi ($2,057). For establishment counts and pay in commercial building, see our report on commercial construction companies by state; individual markets are on our state and city pages.
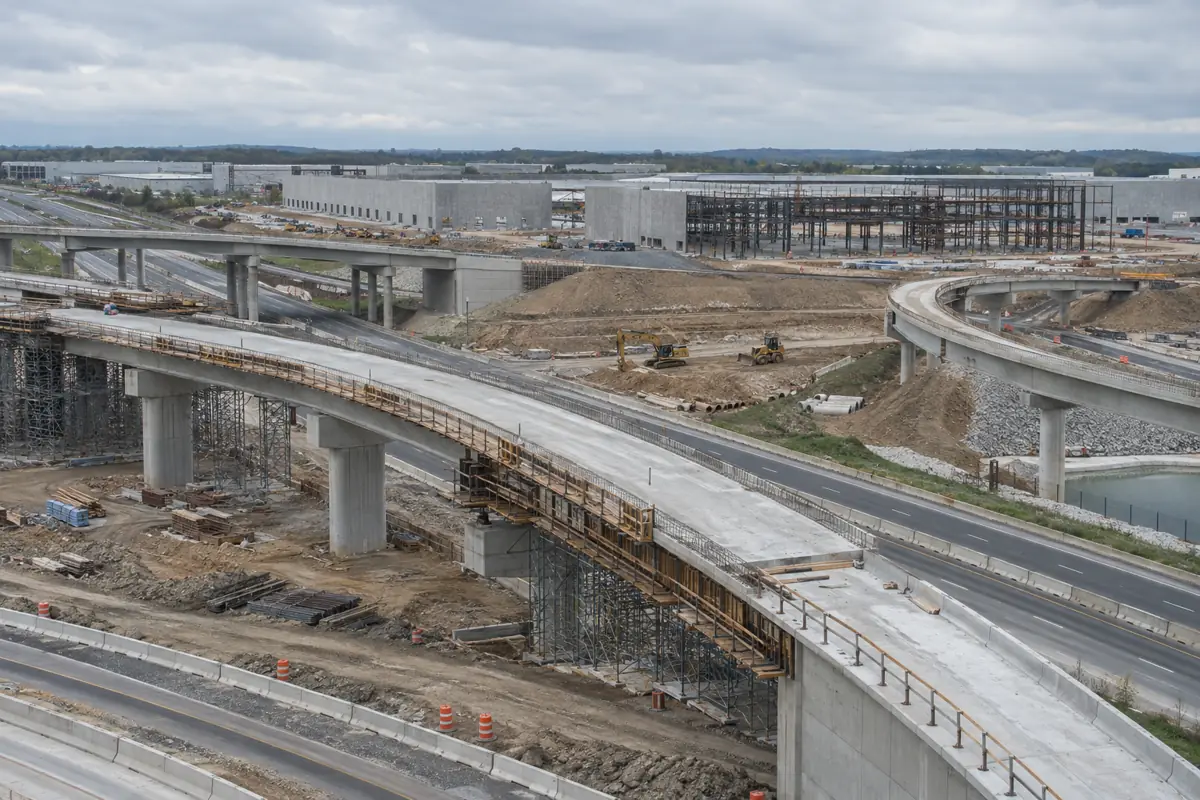
Which states depend most on construction?
Utah, Nevada, Idaho, Montana and Arizona rely most on construction, and three of them (Idaho, Arizona, Utah) also posted the largest share gains since 2019.
Dependence here means the construction share of state GDP. From 2019 to 2025 that share rose in 30 of 51 geographies. The largest gains were in Idaho (+1.13 points), Arizona (+1.03 points), Utah (+0.91 points). The largest declines were in West Virginia (-0.88 points), California (-0.64) and Washington (-0.52).
- Utah: 7.8% of GDP in 2025, up from 6.9% in 2019; real construction GDP +24.9% since 2019.
- Nevada: 7.7% of GDP, up from 7.5%; real construction GDP +8.7%.
- Idaho: 6.6% of GDP, up from 5.5%; the fastest real growth of any state (+36.4%).
- Wyoming (6.3%) and Louisiana (6.0%) rank high on share even though their real construction GDP fell 5.8% and 11.2% from 2019 to 2025.
- Maryland (5.9%) is the only East Coast state in the top 10 by share.
Real construction GDP growth by state, 2019 to 2025
After adjusting for prices, construction output grew in 27 of 51 geographies from 2019 to 2025. The US total fell 2.1% because large states such as California and New York shrank in real terms.
Percent change in construction value added, chained 2017 dollars
Source: U.S. Bureau of Economic Analysis, SAGDP9 real GDP by state (September 30, 2026); CB&C calculation
Real construction GDP is BEA's chained 2017 dollar estimate (BEA SAGDP, SAGDP9). The five fastest-growing states from 2019 to 2025 were Idaho (+36.4%), Arizona (+31.2%), Utah (+24.9%), Tennessee (+18.4%), Montana (+17.9%). The five largest declines were in the District of Columbia (-29.1%), West Virginia (-20.1%), New York (-18.6%), California (-17.4%), Massachusetts (-13.9%). Among the three largest construction states, Texas grew 1.8% and Florida 7.7%, while California fell 17.4%.
Show all 52 rows
| State | Real 2019 ($ millions) | Real 2024 ($ millions) | Real 2025 ($ millions) | Real growth 2019 to 2025 (%) | Compound annual growth (%/yr) | Real growth 2024 to 2025 (%) | Nominal growth 2019 to 2025 (%) | Real all-industry GDP growth 2019 to 2025 (%) | Growth rank (of 51) |
|---|---|---|---|---|---|---|---|---|---|
| Idaho | 4,312.1 | 5,597.4 | 5,882.1 | 36.41 | 5.31 | 5.09 | 95.94 | 27.79 | 1 |
| Arizona | 18,334.7 | 24,600.0 | 24,061.6 | 31.24 | 4.63 | -2.19 | 88.51 | 25.58 | 2 |
| Utah | 12,894.3 | 15,871.9 | 16,109.9 | 24.94 | 3.78 | 1.50 | 79.47 | 26.13 | 3 |
| Tennessee | 13,204.5 | 15,943.3 | 15,637.5 | 18.43 | 2.86 | -1.92 | 70.11 | 20.93 | 4 |
| Montana | 2,794.8 | 3,322.9 | 3,294.3 | 17.87 | 2.78 | -0.86 | 69.31 | 21.58 | 5 |
| Nebraska | 5,454.1 | 6,198.9 | 6,210.1 | 13.86 | 2.19 | 0.18 | 63.55 | 22.85 | 6 |
| Arkansas | 4,859.8 | 5,612.3 | 5,451.2 | 12.17 | 1.93 | -2.87 | 61.12 | 16.32 | 7 |
| North Carolina | 25,020.2 | 27,542.6 | 27,635.1 | 10.45 | 1.67 | 0.34 | 58.66 | 20.23 | 8 |
| South Carolina | 12,272.2 | 12,919.0 | 13,495.5 | 9.97 | 1.60 | 4.46 | 57.96 | 20.15 | 9 |
| Indiana | 16,641.4 | 17,766.3 | 18,243.7 | 9.63 | 1.54 | 2.69 | 57.48 | 14.04 | 10 |
| Nevada | 12,886.7 | 13,652.7 | 14,008.0 | 8.70 | 1.40 | 2.60 | 56.14 | 19.36 | 11 |
| South Dakota | 2,101.3 | 2,296.7 | 2,281.8 | 8.59 | 1.38 | -0.65 | 55.99 | 14.14 | 12 |
| Florida | 59,323.5 | 63,838.8 | 63,893.0 | 7.70 | 1.24 | 0.08 | 54.71 | 26.90 | 13 |
| Maine | 2,284.5 | 2,461.0 | 2,451.4 | 7.31 | 1.18 | -0.39 | 54.14 | 15.69 | 14 |
| Michigan | 18,405.4 | 19,418.7 | 19,719.1 | 7.14 | 1.16 | 1.55 | 53.90 | 10.44 | 15 |
| Mississippi | 3,658.7 | 3,784.3 | 3,916.3 | 7.04 | 1.14 | 3.49 | 53.76 | 10.97 | 16 |
| Georgia | 28,610.5 | 30,333.9 | 30,601.9 | 6.96 | 1.13 | 0.88 | 53.64 | 15.96 | 17 |
| Alabama | 9,821.6 | 10,388.2 | 10,502.4 | 6.93 | 1.12 | 1.10 | 53.60 | 15.19 | 18 |
| Missouri | 13,752.3 | 14,509.4 | 14,592.5 | 6.11 | 0.99 | 0.57 | 52.42 | 12.82 | 19 |
| Virginia | 24,028.6 | 24,593.3 | 25,361.2 | 5.55 | 0.90 | 3.12 | 51.61 | 16.82 | 20 |
| New Mexico | 4,130.7 | 4,274.1 | 4,311.8 | 4.38 | 0.72 | 0.88 | 49.94 | 22.20 | 21 |
| Ohio | 25,609.4 | 25,656.9 | 26,346.4 | 2.88 | 0.47 | 2.69 | 47.78 | 9.55 | 22 |
| Alaska | 2,560.0 | 2,532.5 | 2,623.9 | 2.50 | 0.41 | 3.61 | 47.23 | 7.56 | 23 |
| Kansas | 6,752.8 | 6,795.7 | 6,891.7 | 2.06 | 0.34 | 1.41 | 46.60 | 5.35 | 24 |
| Texas | 90,412.5 | 90,130.6 | 92,035.5 | 1.80 | 0.30 | 2.11 | 46.22 | 29.23 | 25 |
| Wisconsin | 13,909.0 | 13,700.7 | 14,088.3 | 1.29 | 0.21 | 2.83 | 45.50 | 9.30 | 26 |
| Vermont | 1,147.5 | 1,161.1 | 1,152.3 | 0.42 | 0.07 | -0.76 | 44.25 | 14.18 | 27 |
| Kentucky | 8,036.0 | 8,334.8 | 7,987.6 | -0.60 | -0.10 | -4.17 | 42.78 | 13.12 | 28 |
| New Hampshire | 2,688.6 | 2,760.0 | 2,664.1 | -0.91 | -0.15 | -3.47 | 42.34 | 17.29 | 29 |
| Minnesota | 17,004.2 | 16,682.4 | 16,755.6 | -1.46 | -0.25 | 0.44 | 41.54 | 6.17 | 30 |
| Oregon | 11,230.1 | 11,098.6 | 10,691.4 | -4.80 | -0.82 | -3.67 | 36.75 | 10.43 | 31 |
| Iowa | 8,374.6 | 8,002.3 | 7,955.1 | -5.01 | -0.85 | -0.59 | 36.45 | 8.74 | 32 |
| Oklahoma | 7,348.3 | 6,774.7 | 6,967.3 | -5.18 | -0.88 | 2.84 | 36.20 | 8.15 | 33 |
| North Dakota | 3,138.1 | 2,899.1 | 2,962.1 | -5.61 | -0.96 | 2.17 | 35.59 | 9.96 | 34 |
| Delaware | 2,735.4 | 2,627.7 | 2,577.9 | -5.76 | -0.98 | -1.90 | 35.38 | 20.62 | 35 |
| Wyoming | 2,250.1 | 2,171.3 | 2,120.4 | -5.76 | -0.98 | -2.34 | 35.36 | 4.14 | 36 |
| Illinois | 29,319.2 | 27,558.6 | 27,406.7 | -6.52 | -1.12 | -0.55 | 34.27 | 10.44 | 37 |
| Rhode Island | 2,322.7 | 2,151.5 | 2,149.3 | -7.47 | -1.28 | -0.10 | 32.92 | 11.78 | 38 |
| Colorado | 22,811.9 | 21,499.9 | 21,048.7 | -7.73 | -1.33 | -2.10 | 32.54 | 18.01 | 39 |
| Connecticut | 7,491.8 | 6,982.4 | 6,862.9 | -8.39 | -1.45 | -1.71 | 31.59 | 8.01 | 40 |
| Hawaii | 5,195.4 | 4,713.8 | 4,733.9 | -8.88 | -1.54 | 0.43 | 30.88 | 5.11 | 41 |
| New Jersey | 21,269.4 | 19,696.7 | 19,294.8 | -9.28 | -1.61 | -2.04 | 30.31 | 11.34 | 42 |
| Washington | 25,133.2 | 23,300.5 | 22,659.9 | -9.84 | -1.71 | -2.75 | 29.51 | 21.61 | 43 |
| Maryland | 23,976.0 | 21,598.9 | 21,419.7 | -10.66 | -1.86 | -0.83 | 28.33 | 8.67 | 44 |
| Pennsylvania | 30,646.4 | 27,384.9 | 27,324.4 | -10.84 | -1.89 | -0.22 | 28.07 | 5.72 | 45 |
| Louisiana | 15,022.8 | 13,728.3 | 13,342.1 | -11.19 | -1.96 | -2.81 | 27.57 | 6.99 | 46 |
| Massachusetts | 22,127.1 | 19,635.4 | 19,057.2 | -13.87 | -2.46 | -2.94 | 23.71 | 13.16 | 47 |
| California | 119,243.5 | 101,417.9 | 98,545.5 | -17.36 | -3.13 | -2.83 | 18.71 | 15.50 | 48 |
| New York | 54,140.7 | 44,867.6 | 44,051.2 | -18.64 | -3.38 | -1.82 | 16.87 | 10.95 | 49 |
| West Virginia | 3,808.1 | 2,919.3 | 3,044.2 | -20.06 | -3.66 | 4.28 | 14.83 | 10.08 | 50 |
| District of Columbia | 1,790.0 | 1,315.6 | 1,270.0 | -29.05 | -5.56 | -3.47 | 1.91 | 5.68 | 51 |
| United States | 882,288.0 | 865,025.0 | 863,691.0 | -2.11 | -0.35 | -0.15 | 40.62 | 15.58 |
BEA SAGDP9 line 11 (real construction) and line 1 (real all-industry). Chained-dollar values are not additive, so state values do not sum to the US.
Source: [1] U.S. Bureau of Economic Analysis
Construction value added, $ billions
Source: U.S. Bureau of Economic Analysis, SAGDP2 and SAGDP9, United States (September 30, 2026)
The gap between current and real dollars is the main story at the national level. US construction value added rose from $953.0 billion in 2019 to $1.34 trillion in 2025 (+40.6%), but in chained 2017 dollars it fell from $882.3 billion to $863.7 billion. In 2025 alone real construction value added slipped 0.2% nationally, in line with the -0.2% annual change in BEA GDP by industry tables. Real construction GDP rose from 2024 to 2025 in 25 of 51 geographies.
Value added per construction worker by state, 2025
Each construction payroll job corresponded to $162,407 of value added in the US in 2025. The measure is highest in Alaska, Georgia and Maryland and lowest in Maine, Vermont and Mississippi.
Construction value added divided by construction payroll employment
Source: BEA SAGDP2 (September 30, 2026); BLS QCEW 2025 annual averages; *BLS CES state annual average where QCEW is suppressed
Value added per job divides 2025 construction GDP by the 2025 annual average of private construction payroll jobs from BLS QCEW. BLS suppressed 2025 private construction employment for 17 geographies because subsector data, in 16 of them heavy and civil engineering (NAICS 237), are confidential there; for 15 of them we use the BLS CES state data annual average instead (marked *), and Delaware and DC are left blank. Where both exist, QCEW and CES counts agree closely (ratio 0.95 to 1.01).
Show all 52 rows
| State | Construction GDP 2025 ($ millions) | QCEW private construction jobs 2025 | CES construction jobs 2025 | Employment basis used | Construction GDP per job ($) | Rank (of 49) |
|---|---|---|---|---|---|---|
| Alaska | 4,071.0 | suppressed | 19,100 | CES | 213,141 | 1 |
| Georgia | 47,478.9 | 234,615 | 235,400 | QCEW | 202,369 | 2 |
| Maryland | 33,232.6 | 165,130 | 164,900 | QCEW | 201,251 | 3 |
| Nevada | 21,733.4 | 112,044 | 112,200 | QCEW | 193,972 | 4 |
| Hawaii | 7,344.6 | 39,658 | n/p | QCEW | 185,198 | 5 |
| Minnesota | 25,996.3 | 141,493 | 142,400 | QCEW | 183,729 | 6 |
| New Jersey | 29,935.9 | 164,671 | 165,900 | QCEW | 181,792 | 7 |
| Massachusetts | 29,567.2 | suppressed | 165,900 | CES | 178,223 | 8 |
| New York | 68,345.4 | 384,950 | 387,000 | QCEW | 177,544 | 9 |
| Illinois | 42,521.5 | 240,012 | 239,800 | QCEW | 177,164 | 10 |
| Colorado | 32,657.1 | 184,775 | 185,400 | QCEW | 176,740 | 11 |
| Utah | 24,994.6 | suppressed | 142,100 | CES | 175,894 | 12 |
| Virginia | 39,347.9 | 229,192 | 228,100 | QCEW | 171,681 | 13 |
| California | 152,893.5 | 892,415 | 893,600 | QCEW | 171,326 | 14 |
| Washington | 35,156.8 | 207,426 | 217,800 | QCEW | 169,491 | 15 |
| South Carolina | 20,938.3 | suppressed | 123,600 | CES | 169,404 | 16 |
| Arizona | 37,331.5 | 223,800 | 224,600 | QCEW | 166,807 | 17 |
| Connecticut | 10,647.8 | suppressed | 64,200 | CES | 165,854 | 18 |
| Indiana | 28,305.2 | suppressed | 175,000 | CES | 161,744 | 19 |
| Pennsylvania | 42,393.8 | 263,870 | 263,000 | QCEW | 160,662 | 20 |
| Texas | 142,793.2 | 901,963 | 900,500 | QCEW | 158,314 | 21 |
| Ohio | 40,876.4 | 259,526 | 258,800 | QCEW | 157,504 | 22 |
| North Carolina | 42,875.8 | suppressed | 279,000 | CES | 153,677 | 23 |
| North Dakota | 4,595.7 | 30,043 | 30,400 | QCEW | 152,971 | 24 |
| Michigan | 30,594.2 | 201,408 | 200,800 | QCEW | 151,902 | 25 |
| Florida | 99,130.0 | 655,646 | 655,500 | QCEW | 151,194 | 26 |
| Nebraska | 9,635.0 | 63,883 | 64,000 | QCEW | 150,823 | 27 |
| Missouri | 22,640.3 | suppressed | 150,200 | CES | 150,734 | 28 |
| Louisiana | 20,700.4 | suppressed | 138,100 | CES | 149,894 | 29 |
| Wisconsin | 21,858.1 | suppressed | 146,200 | CES | 149,508 | 30 |
| Alabama | 16,294.5 | 109,968 | 109,600 | QCEW | 148,175 | 31 |
| Rhode Island | 3,334.7 | suppressed | 22,600 | CES | 147,553 | 32 |
| Oregon | 16,587.8 | 112,585 | 113,000 | QCEW | 147,336 | 33 |
| Tennessee | 24,261.6 | 165,988 | 166,000 | QCEW | 146,165 | 34 |
| Kansas | 10,692.5 | 73,307 | 73,800 | QCEW | 145,859 | 35 |
| Iowa | 12,342.3 | 85,010 | 83,800 | QCEW | 145,186 | 36 |
| Wyoming | 3,289.7 | 23,396 | 23,300 | QCEW | 140,610 | 37 |
| Montana | 5,111.0 | 36,854 | 37,000 | QCEW | 138,682 | 38 |
| West Virginia | 4,723.0 | 35,253 | 35,100 | QCEW | 133,974 | 39 |
| Kentucky | 12,392.8 | 92,866 | 92,500 | QCEW | 133,448 | 40 |
| New Hampshire | 4,133.3 | 32,400 | 32,400 | QCEW | 127,571 | 41 |
| Arkansas | 8,457.5 | suppressed | 66,400 | CES | 127,372 | 42 |
| Idaho | 9,126.1 | 72,070 | 74,900 | QCEW | 126,628 | 43 |
| New Mexico | 6,689.8 | 55,405 | 54,800 | QCEW | 120,744 | 44 |
| Oklahoma | 10,809.7 | 90,041 | 89,600 | QCEW | 120,053 | 45 |
| South Dakota | 3,540.3 | suppressed | 29,700 | CES | 119,202 | 46 |
| Mississippi | 6,076.2 | 53,778 | 53,700 | QCEW | 112,987 | 47 |
| Vermont | 1,787.8 | suppressed | 16,300 | CES | 109,681 | 48 |
| Maine | 3,803.4 | suppressed | 35,700 | CES | 106,538 | 49 |
| Delaware | 3,999.7 | suppressed | n/p | n/d | n/d | |
| District of Columbia | 1,970.4 | suppressed | n/p | n/d | n/d | |
| United States | 1,340,017.0 | 8,251,002 | QCEW | 162,407 |
QCEW private NAICS 23 annual average where BLS discloses it; CES state construction annual average (not seasonally adjusted) where QCEW is suppressed. Delaware and DC: QCEW suppressed and CES publishes construction only combined with mining and logging, so n/d. n/p = not published. Both employment measures exclude proprietors and the self-employed.
Source: [1][8][13] U.S. Bureau of Economic Analysis; U.S. Bureau of Labor Statistics; U.S. Bureau of Labor Statistics
The top three were Alaska ($213,141), Georgia ($202,369), Maryland ($201,251); the bottom three were Maine ($106,538), Vermont ($109,681), Mississippi ($112,987). Both employment measures exclude proprietors and the unincorporated self-employed (QCEW overview), who are numerous in construction, so value added per job overstates output per person working in the industry, most in states with many self-employed trade contractors.
Nationally, real construction value added per payroll job fell from $118,404 in 2019 to $104,677 in 2025 (chained 2017 dollars), an 11.6% drop, as employment grew 10.7% and real output fell. Our construction productivity tracker covers the long-run national productivity record.
Latest quarter: second quarter 2026 compared with a year earlier
US real construction GDP in the second quarter of 2026 was 0.4% above a year earlier, slower than the 2.2% growth of the whole economy, after three quarters of decline.
Percent change from 2025 Q2, seasonally adjusted annual rates, chained 2017 dollars (34 states with published data)
Source: U.S. Bureau of Economic Analysis, SQGDP9 quarterly GDP by state (September 30, 2026); CB&C calculation
Quarterly state GDP (BEA SQGDP) shows real construction value added up from a year earlier in 19 of 34 states with published data in the second quarter of 2026. The largest gains were Iowa (+12.2%), Idaho (+9.4%), West Virginia (+6.6%); the largest declines were New Hampshire (-5.2%), Washington (-4.1%), New Jersey (-3.8%). Among large states, Texas rose 2.2% while California fell 1.0% and Florida 2.0%.
Show all 35 rows
| State | Real 2025 Q2 ($ millions, SAAR) | Real 2026 Q1 ($ millions, SAAR) | Real 2026 Q2 ($ millions, SAAR) | Change from 2025 Q2 (%) | Change from 2026 Q1, annual rate (%) | Nominal change from 2025 Q2 (%) |
|---|---|---|---|---|---|---|
| Iowa | 7,843.5 | 8,637.7 | 8,796.6 | 12.15 | 7.56 | 14.59 |
| Idaho | 5,842.7 | 6,362.8 | 6,389.6 | 9.36 | 1.70 | 11.75 |
| West Virginia | 3,171.9 | 3,365.2 | 3,381.8 | 6.62 | 1.99 | 8.93 |
| Nevada | 13,900.3 | 14,576.7 | 14,723.1 | 5.92 | 4.08 | 8.24 |
| Ohio | 26,189.6 | 26,831.7 | 27,333.3 | 4.37 | 7.69 | 6.65 |
| Alabama | 10,569.0 | 10,742.6 | 11,028.1 | 4.34 | 11.06 | 6.62 |
| Virginia | 25,177.7 | 26,211.2 | 26,259.5 | 4.30 | 0.74 | 6.57 |
| Montana | 3,301.4 | 3,415.6 | 3,427.6 | 3.82 | 1.41 | 6.09 |
| Kentucky | 7,950.0 | 8,183.9 | 8,220.6 | 3.40 | 1.81 | 5.65 |
| Oklahoma | 7,018.2 | 7,226.1 | 7,249.7 | 3.30 | 1.31 | 5.55 |
| Minnesota | 16,883.3 | 17,068.9 | 17,336.8 | 2.69 | 6.43 | 4.93 |
| Illinois | 27,593.1 | 28,085.5 | 28,230.7 | 2.31 | 2.08 | 4.55 |
| Texas | 92,120.5 | 93,177.2 | 94,120.4 | 2.17 | 4.11 | 4.40 |
| Wyoming | 2,184.3 | 2,211.7 | 2,221.7 | 1.71 | 1.82 | 3.93 |
| Maryland | 21,373.3 | 21,483.0 | 21,523.3 | 0.70 | 0.75 | 2.90 |
| Mississippi | 3,933.7 | 3,914.7 | 3,955.9 | 0.56 | 4.28 | 2.76 |
| North Dakota | 2,966.9 | 3,014.7 | 2,982.5 | 0.53 | -4.20 | 2.73 |
| Nebraska | 6,295.5 | 6,283.1 | 6,316.7 | 0.34 | 2.16 | 2.53 |
| Colorado | 21,149.5 | 21,069.1 | 21,192.2 | 0.20 | 2.36 | 2.39 |
| New Mexico | 4,340.0 | 4,240.5 | 4,331.6 | -0.19 | 8.87 | 1.99 |
| Arizona | 24,443.5 | 24,008.0 | 24,295.9 | -0.60 | 4.88 | 1.57 |
| Oregon | 10,687.0 | 10,514.5 | 10,621.9 | -0.61 | 4.15 | 1.56 |
| California | 99,611.5 | 98,176.7 | 98,592.1 | -1.02 | 1.70 | 1.13 |
| Georgia | 30,701.7 | 30,583.2 | 30,381.9 | -1.04 | -2.61 | 1.12 |
| Michigan | 19,900.1 | 19,493.6 | 19,574.9 | -1.63 | 1.68 | 0.51 |
| New York | 44,127.1 | 42,723.9 | 43,363.2 | -1.73 | 6.12 | 0.41 |
| Florida | 63,735.8 | 61,693.9 | 62,469.2 | -1.99 | 5.12 | 0.15 |
| Tennessee | 15,663.1 | 15,280.1 | 15,322.2 | -2.18 | 1.11 | -0.04 |
| Pennsylvania | 27,523.4 | 26,968.9 | 26,818.8 | -2.56 | -2.21 | -0.44 |
| Kansas | 7,058.9 | 6,816.8 | 6,848.1 | -2.99 | 1.85 | -0.86 |
| Hawaii | 4,756.9 | 4,555.9 | 4,577.6 | -3.77 | 1.92 | -1.67 |
| New Jersey | 19,281.5 | 18,521.7 | 18,550.4 | -3.79 | 0.62 | -1.69 |
| Washington | 23,098.8 | 22,008.2 | 22,147.0 | -4.12 | 2.55 | -2.03 |
| New Hampshire | 2,694.2 | 2,577.5 | 2,555.4 | -5.15 | -3.39 | -3.09 |
| United States | 867,000.0 | 863,119.0 | 870,037.0 | 0.35 | 3.24 | 2.55 |
BEA SQGDP9 and SQGDP2 line 11, released September 30, 2026. BEA shows (D) for construction from 2025 Q1 onward in: Alaska, Arkansas, Connecticut, Delaware, District of Columbia, Indiana, Louisiana, Maine, Massachusetts, Missouri, North Carolina, Rhode Island, South Carolina, South Dakota, Utah, Vermont, Wisconsin.
Source: [2] U.S. Bureau of Economic Analysis
BEA shows construction as (D), withheld to avoid disclosing confidential information, from the first quarter of 2025 onward for Alaska, Arkansas, Connecticut, Delaware, District of Columbia, Indiana, Louisiana, Maine, Massachusetts, Missouri, North Carolina, Rhode Island, South Carolina, South Dakota, Utah, Vermont, Wisconsin. National construction contributed 0.14 percentage point to second quarter real GDP growth of 2.2% (BEA news release of September 30, 2026). Spending data point the other way: the Census Bureau construction spending release shows August 2026 spending 1.7% below a year earlier. Our commercial construction spending tracker follows the nonresidential categories month by month.
Long view: 2025 construction output against each state's peak
US real construction GDP in 2025 was 7.5% below its 2005 peak. Only 4 states set a new high in 2025.
Show all 52 rows
| State | Peak year | Real construction GDP in peak year ($ millions, chained 2017) | Real 2025 ($ millions) | 2025 vs peak (%) |
|---|---|---|---|---|
| Idaho | 2025 | 5,882.1 | 5,882.1 | 0.00 |
| Nebraska | 2025 | 6,210.1 | 6,210.1 | 0.00 |
| Texas | 2025 | 92,035.5 | 92,035.5 | 0.00 |
| Utah | 2025 | 16,109.9 | 16,109.9 | 0.00 |
| North Carolina | 2000 | 27,695.4 | 27,635.1 | -0.22 |
| South Dakota | 2024 | 2,296.7 | 2,281.8 | -0.65 |
| Montana | 2024 | 3,322.9 | 3,294.3 | -0.86 |
| South Carolina | 2004 | 13,628.1 | 13,495.5 | -0.97 |
| Georgia | 2000 | 31,299.1 | 30,601.9 | -2.23 |
| Indiana | 1998 | 19,608.3 | 18,243.7 | -6.96 |
| Tennessee | 1998 | 16,984.2 | 15,637.5 | -7.93 |
| Kansas | 1999 | 7,519.8 | 6,891.7 | -8.35 |
| Colorado | 2021 | 23,023.9 | 21,048.7 | -8.58 |
| Alaska | 2004 | 2,930.6 | 2,623.9 | -10.47 |
| Iowa | 2016 | 9,029.5 | 7,955.1 | -11.90 |
| Maryland | 2017 | 24,317.1 | 21,419.7 | -11.92 |
| Washington | 2021 | 25,905.0 | 22,659.9 | -12.53 |
| Virginia | 2005 | 29,040.9 | 25,361.2 | -12.67 |
| Minnesota | 2004 | 19,307.5 | 16,755.6 | -13.22 |
| Alabama | 2000 | 12,127.0 | 10,502.4 | -13.40 |
| Wisconsin | 2000 | 16,498.0 | 14,088.3 | -14.61 |
| Missouri | 2000 | 17,243.7 | 14,592.5 | -15.37 |
| Arizona | 2006 | 28,433.2 | 24,061.6 | -15.37 |
| Arkansas | 2000 | 6,474.9 | 5,451.2 | -15.81 |
| Oklahoma | 2013 | 8,276.2 | 6,967.3 | -15.82 |
| Oregon | 1997 | 12,737.2 | 10,691.4 | -16.06 |
| New York | 2018 | 54,280.3 | 44,051.2 | -18.84 |
| Louisiana | 2018 | 16,445.6 | 13,342.1 | -18.87 |
| Florida | 2005 | 79,332.0 | 63,893.0 | -19.46 |
| Hawaii | 2007 | 5,880.1 | 4,733.9 | -19.49 |
| Ohio | 1999 | 32,972.9 | 26,346.4 | -20.10 |
| Pennsylvania | 2001 | 34,238.7 | 27,324.4 | -20.19 |
| Massachusetts | 2001 | 23,887.9 | 19,057.2 | -20.22 |
| New Mexico | 2007 | 5,484.1 | 4,311.8 | -21.38 |
| Nevada | 2005 | 17,889.9 | 14,008.0 | -21.70 |
| Delaware | 2005 | 3,369.1 | 2,577.9 | -23.48 |
| Wyoming | 2008 | 2,785.7 | 2,120.4 | -23.88 |
| Kentucky | 1999 | 10,656.5 | 7,987.6 | -25.04 |
| California | 2005 | 132,226.3 | 98,545.5 | -25.47 |
| District of Columbia | 2019 | 1,790.0 | 1,270.0 | -29.05 |
| New Jersey | 2001 | 28,225.3 | 19,294.8 | -31.64 |
| North Dakota | 2014 | 4,552.7 | 2,962.1 | -34.94 |
| West Virginia | 2018 | 4,766.9 | 3,044.2 | -36.14 |
| Vermont | 2004 | 1,808.8 | 1,152.3 | -36.29 |
| Maine | 2004 | 3,863.2 | 2,451.4 | -36.54 |
| Connecticut | 2000 | 11,047.7 | 6,862.9 | -37.88 |
| Illinois | 2000 | 44,215.9 | 27,406.7 | -38.02 |
| New Hampshire | 2004 | 4,321.8 | 2,664.1 | -38.36 |
| Rhode Island | 2004 | 3,501.9 | 2,149.3 | -38.62 |
| Michigan | 2000 | 32,358.8 | 19,719.1 | -39.06 |
| Mississippi | 2008 | 6,851.9 | 3,916.3 | -42.84 |
| United States | 2005 | 934,014.0 | 863,691.0 | -7.53 |
BEA SAGDP9 line 11, 1997 to 2025. A value of 0.00 means 2025 is the peak year. NAICS-based state GDP starts in 1997.
Source: [1] U.S. Bureau of Economic Analysis
Real construction GDP was at its highest level since 1997 in 2025 in Idaho, Nebraska, Texas, Utah. At the other end, 14 states remained 25% or more below their peak year; Mississippi was furthest below at 42.8%. California was 25.5% below its 2005 peak and Florida 19.5% below its 2005 peak.
How to read state construction GDP: definitions and caveats
State construction GDP covers all construction, residential and nonresidential, and the latest year is a first annual estimate that BEA will revise.
Construction (NAICS 23): The construction sector: building construction, heavy and civil engineering construction, and specialty trade contractors, both residential and nonresidential. BEA does not publish a commercial-only GDP figure by state.
Real GDP (chained 2017 dollars): BEA's inflation-adjusted measure. Chained-dollar values are not additive, so state values do not sum to the US and shares must be computed in current dollars.
Seasonally adjusted annual rate (SAAR): Quarterly values are expressed as if the quarter's pace lasted a full year. Quarter-to-quarter changes in this report are annualized; year-over-year changes compare the same quarter in two years.
The 2025 annual and 2026 quarterly figures come from BEA's release of September 30, 2026; BEA lists December 23, 2026 as the next state GDP release (BEA GDP by State). None of the figures in this report are investment, legal or tax advice.
State-by-state findings
- US construction value added was $1.34 trillion in 2025, 4.3% of all-industry GDP of $30.86 trillion (BEA SAGDP).[1]
- California had the largest construction economy in 2025 at $152.9 billion, ahead of Texas at $142.8 billion and Florida at $99.1 billion.[1]
- Utah had the highest construction share of state GDP in 2025 at 7.8%, followed by Nevada at 7.7% and Idaho at 6.6%.[1]
- 7 states had a construction share of 6% or more in 2025; New York (2.77%) and Connecticut (2.78%) had the lowest shares among the 50 states.[1]
- Construction's share of state GDP rose from 2019 to 2025 in 30 of 51 geographies; Idaho gained the most (+1.13 points) and West Virginia lost the most (-0.88 points).[1]
- Idaho's real construction GDP grew 36.4% from 2019 to 2025, the fastest of any state, followed by Arizona (31.2%) and Utah (24.9%).[1]
- Real construction GDP fell 29.1% in the District of Columbia, 20.1% in West Virginia, 18.6% in New York and 17.4% in California from 2019 to 2025.[1]
- US real construction value added fell 2.1% from 2019 to 2025 while real all-industry GDP grew 15.6%.[1]
- The implied price of construction value added (current dollars divided by chained dollars) rose 43.6% from 2019 to 2025 in every state, so state differences in real growth mirror differences in current-dollar growth.[1]
- Real construction GDP set a 1997-to-2025 high in 2025 in 4 states (Idaho, Nebraska, Texas, Utah); in 14 states it was 25% or more below its peak year.[1]
- Construction GDP per construction payroll job was $162,407 in the US in 2025; Alaska was highest at $213,141 and Maine lowest at $106,538.[1][8][13]
- US real construction GDP per payroll job fell 11.6% from 2019 to 2025 (chained 2017 dollars), as private construction employment rose 10.7% (BLS QCEW).[1][8][9]
- In the second quarter of 2026, real construction GDP was above its year-earlier level in 19 of the 34 states with published data, led by Iowa (+12.2%), Idaho (+9.4%), West Virginia (+6.6%).[2]
- BEA withheld quarterly construction GDP for 17 of 51 geographies, including DC, from 2025 onward to avoid disclosing confidential data; annual 2025 values are published for all 51.[1][2]
Rankings and ratios we derived
Construction share of state GDP, 2025, and rank
Formulaconstruction GDP 2025 (SAGDP2 line 11) / all-industry GDP 2025 (SAGDP2 line 1) x 100; ranked among 50 states and DC
Inputs: fact sheet rows nom_c_2025 and nom_t_2025 per state; derived ids XX-share and XX-sharerank (fact sheet rows)
Result: US 4.3%; highest Utah 7.8%; lowest District of Columbia 1.0%; 30 of 51 geographies raised their share from 2019
Shows how much of each state's economy comes directly from construction activity.
Limitations: Includes residential construction; excludes materials, design and real estate activity tied to construction; 2025 is a first annual estimate.
Real construction GDP growth, 2019 to 2025
Formula(real construction GDP 2025 / real construction GDP 2019 - 1) x 100, chained 2017 dollars (SAGDP9 line 11)
Inputs: fact sheet rows real_c_2019 and real_c_2025 per state; derived ids XX-realg, XX-cagr (fact sheet rows)
Result: US -2.1%; fastest Idaho +36.4%; slowest District of Columbia -29.1%; 27 of 51 grew
Separates real output change from price change; the national decline contrasts with a 40.6% current-dollar rise.
Limitations: The implied price change is identical (43.6%) in every state, so state real growth tracks current-dollar growth and does not reflect local cost differences.
Construction value added per payroll job, 2025
Formulaconstruction GDP 2025 x 1,000,000 / private construction employment 2025 (QCEW; CES where QCEW is suppressed)
Inputs: fact sheet rows nom_c_2025, emp_2025, ces_2025 per state; derived ids XX-vapw (fact sheet rows)
Result: US $162,407; highest Alaska $213,141; lowest Maine $106,538; 49 states computed (34 QCEW, 15 CES)
A rough gauge of output per payroll worker; since value added is compensation plus taxes on production plus gross operating surplus, higher values can reflect higher pay, higher operating surplus, or more work done by people outside the payroll count.
Limitations: Excludes proprietors and the self-employed; CES includes government-owned construction employment while QCEW counts are private only; Delaware and DC not computed.
Latest quarter vs a year earlier
Formula(real construction GDP 2026 Q2 / 2025 Q2 - 1) x 100, SAAR (SQGDP9 line 11)
Inputs: fact sheet rows q_real_c_2026Q2 and q_real_c_2025Q2; derived ids XX-qyoy, XX-qqoq (fact sheet rows)
Result: US +0.4%; 19 of 34 published states up; highest Iowa +12.2%; lowest New Hampshire -5.2%
The first read on 2026: construction output is roughly flat on the year nationally, with a rebound in the second quarter.
Limitations: 17 geographies withheld (D); quarterly state estimates are early and are revised with each release.
2025 real construction GDP vs peak year
Formula(real 2025 / maximum real value 1997 to 2025 - 1) x 100
Inputs: fact sheet rows real_c_2025 and real_c_peak; derived ids XX-peak (fact sheet rows)
Result: US -7.5% vs 2005; 4 states at a new high in 2025; 14 states 25% or more below peak
Shows how far each state's construction economy is from its best year in real terms.
Limitations: NAICS state series start in 1997; earlier peaks are not visible.
Executive summary
- Construction added $1.34 trillion to US GDP in 2025, 4.3% of all-industry GDP, down from 4.4% in 2019 (BEA SAGDP).
- California ($152.9 billion), Texas ($142.8 billion) and Florida ($99.1 billion) produced 29.5% of the nation's construction value added in 2025.
- Construction's share of GDP is highest in Utah (7.8%), Nevada (7.7%), Idaho (6.6%), Montana (6.3%), Arizona (6.3%); it is lowest in the District of Columbia (1.0%), New York (2.77%), Connecticut (2.78%), New Hampshire (3.22%).
- Measured in chained 2017 dollars, construction GDP grew from 2019 to 2025 in 27 of 51 geographies, led by Idaho (+36.4%), Arizona (+31.2%), Utah (+24.9%), Tennessee (+18.4%), Montana (+17.9%).
- Nationally, real construction value added fell 2.1% from 2019 to 2025 while current-dollar value rose 40.6%: rising prices, not more real output, explain the dollar growth.
- Value added per construction payroll job was $162,407 in the US in 2025, from Alaska ($213,141), Georgia ($202,369), Maryland ($201,251) at the top to Maine ($106,538), Vermont ($109,681), Mississippi ($112,987) at the bottom.
- In the second quarter of 2026, US real construction GDP was 0.4% above a year earlier and grew at a 3.2% annual rate from the first quarter (BEA SQGDP).
Questions people ask
How much does construction contribute to GDP?
Construction contributed $1.34 trillion to US GDP in 2025, 4.3% of the total, according to BEA's annual update of September 30, 2026 (BEA SAGDP). In the second quarter of 2026 construction value added ran at a $1,373.7 billion annual rate, 4.2% of GDP (BEA GDP by industry tables).
Which state has the largest construction industry?
California, with $152.9 billion of construction value added in 2025, followed by Texas ($142.8 billion) and Florida ($99.1 billion). Measured in real terms, Texas set a record in 2025 while California was 17.4% below its 2019 level.
What percentage of GDP is construction?
4.3% in 2025 for the US (BEA SAGDP), compared with 4.4% in 2019 and 4.5% in 2024. By state it ranges from 1.0% in the District of Columbia to 7.8% in Utah.
Which states depend most on construction?
By construction share of state GDP in 2025: Utah (7.8%), Nevada (7.7%), Idaho (6.6%), Montana (6.3%), Arizona (6.3%). Wyoming (6.3%), Louisiana (6.0%), Hawaii (6.0%), Maryland (5.9%) and Colorado (5.7%) complete the top 10.
Is construction GDP growing in 2026?
Slightly. US real construction GDP in the second quarter of 2026 was 0.4% above the second quarter of 2025 and grew at a 3.2% annual rate from the first quarter, after declines of 0.4%, 0.9% and 0.5% (annual rates) in the three prior quarters (BEA GDP by industry tables). Current-dollar construction GDP was 2.6% higher than a year earlier (BEA SQGDP).
Download the data
Every table in this report is available as a CSV under CC BY 4.0. The fact sheet lists each value with its source URL and access date.
- derived_metrics.csv (CSV)
- fact_sheet.csv (CSV)
- Construction GDP by state, 2025: value added, share of the state economy and per resident (ranked by share) (CSV)
- Real construction GDP by state, 2019 to 2025 (chained 2017 dollars, ranked by growth) (CSV)
- Construction GDP per construction payroll job by state, 2025 (CSV)
- Latest quarter: real construction GDP in the second quarter of 2026 vs a year earlier (states with published data) (CSV)
- Real construction GDP in 2025 compared with each state's peak year since 1997 (CSV)
- United States construction GDP, 2019 to 2025: current dollars, chained 2017 dollars and share of GDP (CSV)
For journalists and researchers
If you cite only a few, cite these
- Construction added $1.34 trillion to US GDP in 2025, 4.3% of the economy (BEA, September 30, 2026).[1]
- Utah is the most construction-dependent state: construction was 7.8% of its GDP in 2025.[1]
- US real construction GDP fell 2.1% from 2019 to 2025 even as current-dollar value added rose 40.6%.[1]
Most quotable statistics
- Construction added $1.34 trillion to US GDP in 2025, 4.3% of the economy (BEA, September 30, 2026).[1]
- Utah is the most construction-dependent state: construction was 7.8% of its GDP in 2025.[1]
- US real construction GDP fell 2.1% from 2019 to 2025 even as current-dollar value added rose 40.6%.[1]
- Idaho's real construction GDP grew 36.4% from 2019 to 2025, the fastest of any state.[1]
- California, Texas and Florida produced 29.5% of US construction value added in 2025.[1]
- Each US construction payroll job corresponded to $162,407 of value added in 2025.[1][8]
- In the second quarter of 2026, US real construction GDP was 0.4% above a year earlier.[2]
Press summary
US construction generated $1.34 trillion of value added in 2025, 4.3% of GDP, according to a Commercial Builders & Contractors analysis of Bureau of Economic Analysis state GDP data released September 30, 2026. California has the largest construction economy at $152.9 billion, followed by Texas and Florida. Construction matters most in Utah, where it is 7.8% of state GDP, and in Nevada (7.7%). After adjusting for prices, national construction output fell 2.1% from 2019 to 2025 even though current-dollar value rose 40.6%. Real construction GDP grew in 27 of 51 geographies, led by Idaho (+36.4%), Arizona and Utah, and fell most in the District of Columbia, West Virginia, New York and California. Value added per construction payroll job averaged $162,407. In the second quarter of 2026, real construction GDP was 0.4% above a year earlier. All data and calculations are published as CSV files.
Suggested headlines
- Construction Is 7.8% of Utah's Economy, the Highest Share in the US
- US Construction GDP Hit $1.34 Trillion in 2025, but Real Output Is Below 2019
- Idaho's Construction Economy Grew 36.4% in Real Terms Since 2019
- California, Texas and Florida Produce 29.5% of US Construction GDP
- Real Construction GDP Shrank in 23 States and DC From 2019 to 2025
How to cite this report
Commercial Builders & Contractors. (2026). Construction GDP by State: Share of Each Economy, Real Growth and Output per Worker, 2025. Retrieved from https://commercialbuildersandcontractors.com/construction-gdp-by-state/
Reuse license
Data and tables are licensed CC BY 4.0. Attribution: “Source: Commercial Builders & Contractors, Construction GDP by State: Share of Each Economy, Real Growth and Output per Worker, 2025” with a link to this page.
Frequently asked questions
What is construction GDP?
Construction GDP is the value added by the construction industry: gross output less purchased inputs such as materials. BEA publishes it for every state in its GDP by state tables (SAGDP2 in current dollars, SAGDP9 in chained 2017 dollars).
How big is construction GDP in the United States in 2025?
$1.34 trillion in current dollars and $863.7 billion in chained 2017 dollars in 2025 (BEA SAGDP).
Which state has the highest construction share of GDP?
Utah, at 7.8% in 2025, followed by Nevada at 7.7%.
Which state has the lowest construction share of GDP?
Among the 50 states, New York at 2.77% in 2025, just below Connecticut (2.78%). The District of Columbia is lower still at 1.0%.
Where has construction GDP grown fastest since 2019?
Idaho: real construction GDP rose 36.4% from 2019 to 2025. Arizona (+31.2%) and Utah (+24.9%) follow.
Why did US real construction GDP fall while dollars rose?
From 2019 to 2025 the implied price of construction value added rose 43.6%, more than the 40.6% rise in current-dollar value added, so real value added fell 2.1%.
How much construction GDP is there per worker?
$162,407 per private construction payroll job in the US in 2025, using BLS QCEW employment of 8,251,002 jobs (BLS QCEW).
How much of US construction GDP comes from California, Texas and Florida?
29.5% in 2025, based on the sum of state values.
Why are some states missing from the quarterly data?
BEA shows (D) for construction in 17 of 51 geographies, including DC, from the first quarter of 2025, to avoid disclosing confidential information. The annual 2025 figures are published for all states.
When will state construction GDP be updated next?
BEA lists December 23, 2026 as the next GDP by state release, covering the third quarter of 2026. Annual 2025 values will be revised again in the next annual update.
Methodology
Source selection: state construction value added comes from the Bureau of Economic Analysis GDP by state tables, the official source for state GDP by industry. We used SAGDP2 (current dollars) and SAGDP9 (chained 2017 dollars), line 11 (construction, NAICS 23) and line 1 (all-industry total), from the bulk file last updated September 30, 2026, and the quarterly SQGDP2 and SQGDP9 tables from the same release, which added the second quarter of 2026. National comparisons use BEA's GDP by industry workbook published the same day.
Employment: value added per job uses BLS Quarterly Census of Employment and Wages private NAICS 23 annual averages for 2025 (state rows, ownership code 5). Where BLS suppressed 2025 state employment (disclosure code N), we used the BLS Current Employment Statistics state construction series (not seasonally adjusted, annual average, period M13) from the flat file dated September 18, 2026. Delaware and DC publish construction only combined with mining and logging in CES, so no value is computed for them. Population is the Census Bureau Vintage 2025 estimate for July 1, 2025.
Inclusion and exclusion: all 50 states and the District of Columbia are included in annual rankings. Quarterly comparisons cover the 34 states for which BEA published construction values; (D) cells were not estimated or imputed. Shares are computed in current dollars because chained-dollar values are not additive. Market-research estimates were not used.
Conflicting numbers: the BEA state file and the national industry accounts agree on US construction value added for 2025 and for the second quarter of 2026; the national tables round the 2025 share to 4.3%, which matches our unrounded 4.34%. An earlier Associated Builders and Contractors analysis of 2015 data used an older BEA vintage; we report its figures as published and show the current-vintage values beside them.
Derived metrics: shares, growth rates, compound annual growth, per-resident values, value added per job, quarter-over-year changes, peak comparisons and ranks are computed in scripts/build_data.py and scripts/build_ledgers.py and listed with formulas and input rows in derived_metrics.csv. Ranks are among 51 geographies (50 states and DC), or among states with data where noted.
Limitations: 2025 is BEA's first annual estimate and will be revised; quarterly state estimates are early. Construction GDP covers residential and nonresidential work together. Value added per job excludes the self-employed from the denominator. The implied price change for construction is identical in every state, so real growth does not reflect local cost differences. Last updated 2026-10-18.
This report presents published data with its limitations. It is not legal, financial or investment advice.
Sources, ranked by quality
Tier 1: primary and official sources (17)
- [1] U.S. Bureau of Economic Analysis. GDP by state and industry, annual (SAGDP tables: SAGDP2 current dollars, SAGDP9 chained 2017 dollars), bulk download. 1997 to 2025; last updated September 30, 2026. Accessed 2026-10-18.
- [2] U.S. Bureau of Economic Analysis. Quarterly GDP by state and industry (SQGDP tables: SQGDP2 current dollars, SQGDP9 chained 2017 dollars), bulk download. 2005 Q1 to 2026 Q2; last updated September 30, 2026. Accessed 2026-10-18.
- [3] U.S. Bureau of Economic Analysis. GDP (Third Estimate), Industries, Corporate Profits, State GDP, and State Personal Income, 2nd Quarter 2026 and Annual Update (news release BEA 26-42). 2026 Q2; released September 30, 2026. Accessed 2026-10-18.
- [4] U.S. Bureau of Economic Analysis. GDP by State (program page: current and next release dates). Current release September 30, 2026; next release December 23, 2026. Accessed 2026-10-18.
- [5] U.S. Bureau of Economic Analysis. GDP by Industry: Value Added tables (TVA101, TVA105, TVA110), workbook. 1997 to 2025 annual; 2005 Q1 to 2026 Q2 quarterly; published September 30, 2026. Accessed 2026-10-18.
- [6] U.S. Bureau of Economic Analysis. GDP by Industry (program page). Current release September 30, 2026. Accessed 2026-10-18.
- [7] U.S. Bureau of Economic Analysis. Glossary: Value added. Definition. Accessed 2026-10-18.
- [8] U.S. Bureau of Labor Statistics. QCEW open data, NAICS 23 Construction, 2025 annual averages (CSV slice). 2025 annual average. Accessed 2026-10-18.
- [9] U.S. Bureau of Labor Statistics. QCEW open data, NAICS 23 Construction, 2019 annual averages (CSV slice). 2019 annual average. Accessed 2026-10-18.
- [10] U.S. Bureau of Labor Statistics. QCEW open data, NAICS 237 Heavy and civil engineering construction, 2025 annual averages (CSV slice). 2025 annual average. Accessed 2026-10-18.
- [11] U.S. Bureau of Labor Statistics. QCEW Overview (coverage and employment exclusions). Program documentation. Accessed 2026-10-18.
- [12] U.S. Bureau of Labor Statistics. QCEW release calendar. 2025 and 2026 release dates. Accessed 2026-10-18.
- [13] U.S. Bureau of Labor Statistics. Current Employment Statistics, State and Area: construction series flat file (sm.data.62.Construction.Current). 2019 and 2025 annual averages (not seasonally adjusted); file dated September 18, 2026. Accessed 2026-10-18.
- [14] U.S. Bureau of Labor Statistics. State and Metro Area Employment, Hours, and Earnings (program page). Next state release October 20, 2026. Accessed 2026-10-18.
- [15] U.S. Census Bureau. Annual Estimates of the Resident Population, Vintage 2025 (NST-EST2025-ALLDATA). July 1, 2025. Accessed 2026-10-18.
- [16] U.S. Census Bureau. State Population Totals: 2020-2025 (Vintage 2025 program page). Vintage 2025. Accessed 2026-10-18.
- [17] U.S. Census Bureau. Monthly Construction Spending, August 2026 (release CB26-158). August 2026; released October 1, 2026. Accessed 2026-10-18.
Tier 2: trade bodies, market research, company data (2)
- [18] Associated Builders and Contractors. Construction's Contribution to Economy Increases in 30 States in 2015 (news release). 2015. Accessed 2026-10-18.
- [19] Associated Builders and Contractors. State Construction Share of Real GDP State Ranking (PDF). 1997 to 2013. Accessed 2026-10-18.
Tier 3: journalism and expert commentary (1)
- [20] ForConstructionPros.com. Construction Continues to Increase Its Percentage Contribution to National GDP. 2015 data; published August 18, 2016. Accessed 2026-10-18.