Tariffs on Construction Materials in 2026: What Applies and How Prices Moved
- Primary data
- BLS Producer Price Indexes and Import Price Indexes; Federal Register proclamations
- Data period
- January 2025 to August 2026
- Latest release used
- 2026-09-16
- Next release
- 2026-10-15 (PPI) and 2026-10-16 (import prices)
- Geography
- United States
- Sources
- 37 (31 Tier 1)
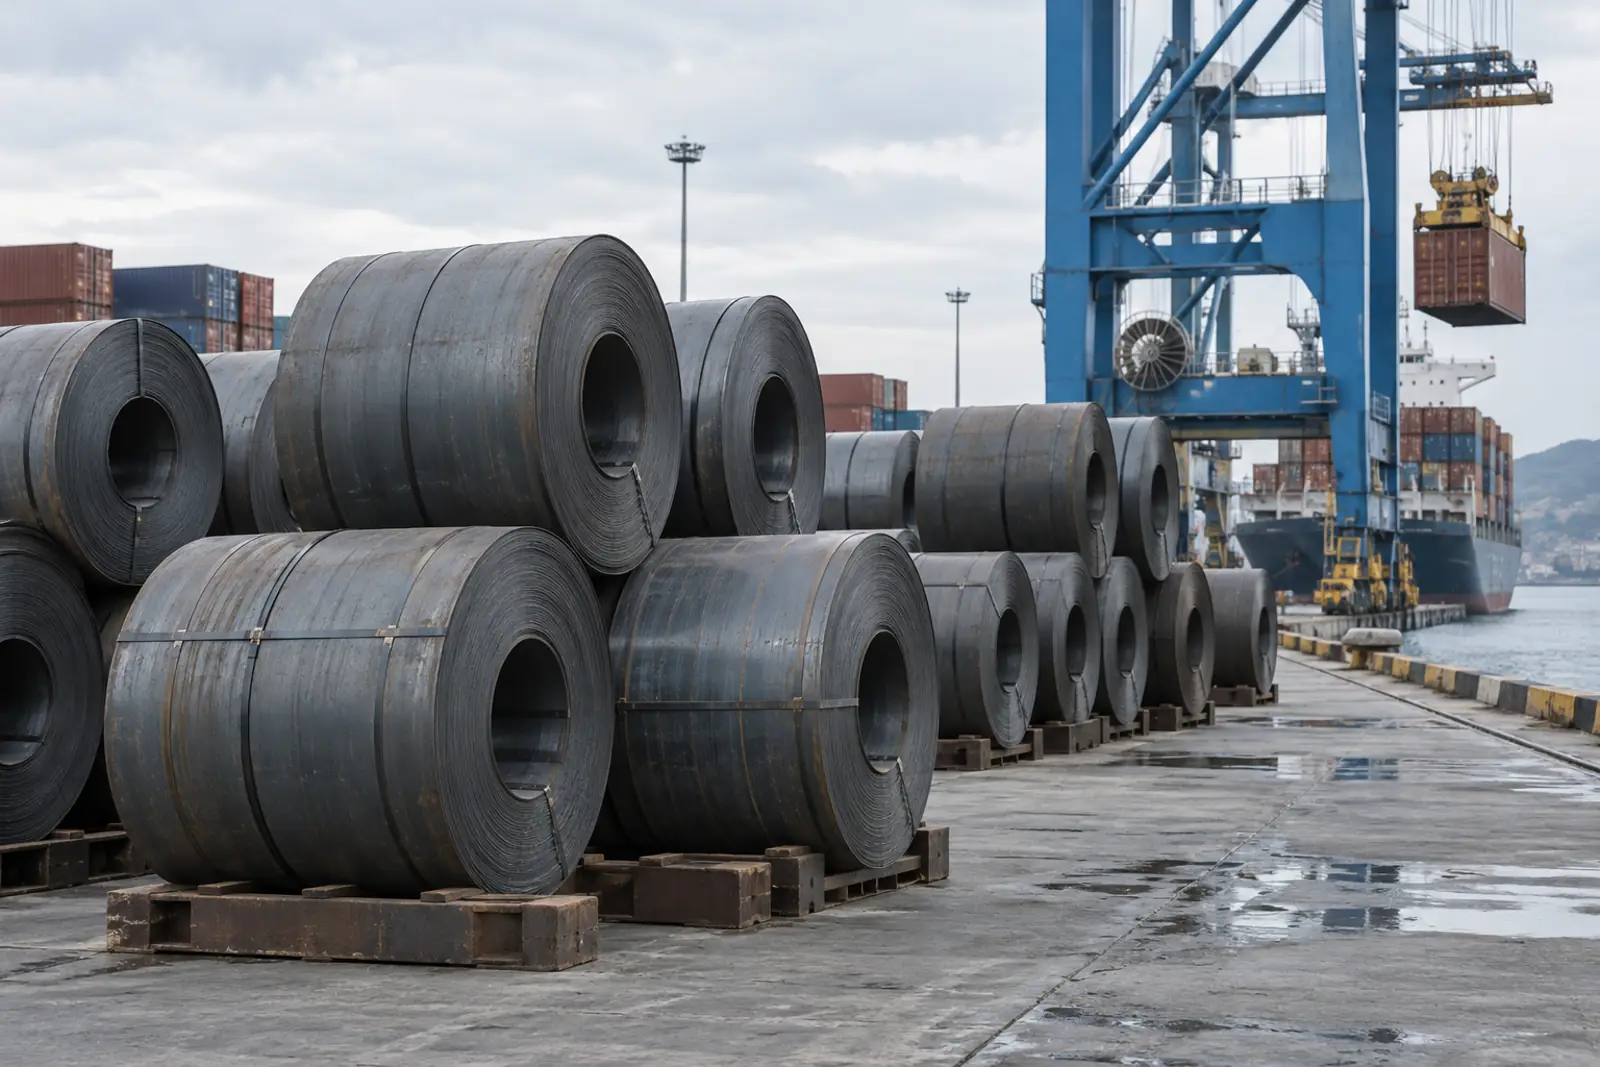
Tariffs on construction materials in 2026 center on Section 232: 50% on steel, aluminum and most copper articles, charged on full value since April 6, 25% on many metal derivatives and 10% on softwood lumber. From January 2025 to August 2026, BLS producer prices rose 50.2% for aluminum mill shapes, 45.7% for steel and 10.2% for softwood lumber.
Which tariffs on construction materials apply in 2026?
Section 232 sets the rate that matters most: 50% on steel, aluminum and most copper articles, 25% on listed metal derivatives and 10% on softwood lumber, all charged on full customs value for metals since 2026-04-06. Canadian lumber also carries antidumping and countervailing duties, and newer Section 301 and Section 338 tariffs reach some other inputs.
Section 232: A provision of the Trade Expansion Act of 1962 that lets the President adjust imports found to threaten national security. All U.S. steel, aluminum, copper and lumber tariffs in this report use it, except where another authority is named.
Steel and aluminum moved first. Proclamation 10896 restored a 25% steel tariff for all countries from 2025-03-12, Proclamation 10895 lifted aluminum from 10% to 25% the same day, and Proclamation 10947 doubled both to 50% from 2025-06-04, with the United Kingdom kept at 25% (90 FR 24199).
Copper followed on 2025-08-01 with 50% on semi-finished copper products and intensive copper derivatives, at first charged only on copper content (90 FR 37727). Proclamation 11021 then moved all three metals to full customs value from 2026-04-06 and sorted products into a 50% group, a 25% derivative group, a 10% rate for goods made entirely from U.S.-melted metal and a 15% total duty for fixed industrial machinery and power equipment through 2027-12-31 (91 FR 18201).
Proclamation 11032 set a temporary 25% rate for mobile industrial equipment and machinery (Annex I-C) from 2026-06-08, a category whose users it says include construction, moved residential HVAC and agricultural equipment into the 15% group, and cut the threshold for 'entirely' U.S. metal from 95% to 85% by weight (91 FR 34085).
| Effective | Action | Authority | Products relevant to construction | Rate (as officially stated) | Citation |
|---|---|---|---|---|---|
| 2025-03-12 | Proclamation 10896 | Section 232 | Steel articles and derivatives, all countries; country arrangements ended | 25% | 90 FR 9817 |
| 2025-03-12 | Proclamation 10895 | Section 232 | Aluminum articles and derivatives | 25% (from 10%) | 90 FR 9807 |
| 2025-06-04 | Proclamation 10947 | Section 232 | Steel and aluminum articles and derivatives | 50% (UK 25%) | 90 FR 24199 |
| 2025-08-01 | Proclamation 10962 | Section 232 | Semi-finished copper products and intensive copper derivatives (copper content) | 50% | 90 FR 37727 |
| 2025-08-12 and 2025-09-11 | Commerce AD and CVD reviews (2023) | Antidumping and countervailing duty | Canadian softwood lumber, non-selected firms | 20.53% AD + 14.63% CVD | 90 FR 44035; 90 FR 38755 |
| 2025-10-14 | Proclamation 10976 | Section 232 | Softwood timber and lumber; kitchen cabinets and vanities; certain upholstered wood products | 10%; 25%; 25% | 90 FR 48127 |
| 2027-01-01 (delayed) | Proclamation 11000 | Section 232 | Scheduled increase for cabinets and vanities and upholstered wood products moved from 2026-01-01 | 50%; 30% | 91 FR 1039 |
| 2026-02-20 | Executive Order 14389 | IEEPA | IEEPA ad valorem duties, including reciprocal tariffs, ended | Ended | 91 FR 9437 |
| 2026-02-24 to 2026-07-24 | Proclamation 11012 | Section 122 | Temporary surcharge on most imports; not applied to the Section 232 portion | 10% | 91 FR 9339 |
| 2026-04-06 | Proclamation 11021 | Section 232 | Metals duties on full customs value; Annex I-A articles; Annex I-B derivatives; U.S.-metal derivatives; Annex III machinery (total duty) | 50%; 25%; 10%; 15% | 91 FR 18201 |
| 2026-06-08 | Proclamation 11032 | Section 232 | Mobile industrial equipment to 2027-12-31; agricultural equipment and residential HVAC moved to the 15% group | 25%; 15% | 91 FR 34085 |
| 2026-07-20 | Proclamation 11045 | Section 232 | Primary aluminum quota at half the Section 232 rate for approved onshoring plans | Half rate | 91 FR 46635 |
| 2026-07-24 | USTR Section 301 action | Section 301 | Goods of economies found actionable; articles under Section 232 exempted as proposed | 10% or 12.5% | 91 FR 47318 |
| 2026-08-15 | Proclamation 11051 | Section 201 safeguard | Quartz surface products, tariff-rate quota for 4 years | Rates in annex | 91 FR 50645 |
| 2026-08-22 | Proclamation 11048 | Section 338 | Listed Canadian products; Section 232 articles excluded as first issued | 50% | 91 FR 46663 |
| 2026-09-15 | Proclamation 11065 | Section 338 | Canadian Annex I Part A products; duty applies in addition to Section 232 | 50% | 91 FR 58339 |
Rates are the additional ad valorem duties stated in each document. Product scope is set by annexes; check the HTSUS line for a specific product. Status checked against the Federal Register on 2026-10-08.
Source: [1][2][3][4][5][6][7][8][9][10][11][12][13][14][15][16][17] Executive Office of the President, Federal Register; Executive Office of the President, Federal Register; Executive Office of the President, Federal Register; Executive Office of the President, Federal Register; Executive Office of the President, Federal Register; Executive Office of the President, Federal Register; Executive Office of the President, Federal Register; Executive Office of the President, Federal Register; Executive Office of the President, Federal Register; Executive Office of the President, Federal Register; Executive Office of the President, Federal Register; Office of the U.S. Trade Representative, Federal Register; Executive Office of the President, Federal Register; Executive Office of the President, Federal Register; Executive Office of the President, Federal Register; U.S. Department of Commerce, International Trade Administration; U.S. Department of Commerce, International Trade Administration
Two narrower actions reach finishes and site equipment. A safeguard tariff-rate quota on quartz surface products started 2026-08-15 for 4 years, and Section 338 duties of 50% on listed Canadian products started 2026-08-22. The Section 338 product lists sit in annex images; AGC's tariff page names cement, paint and plywood among the covered goods (AGC).
How much have steel, aluminum, copper and lumber prices risen since the tariffs took effect?
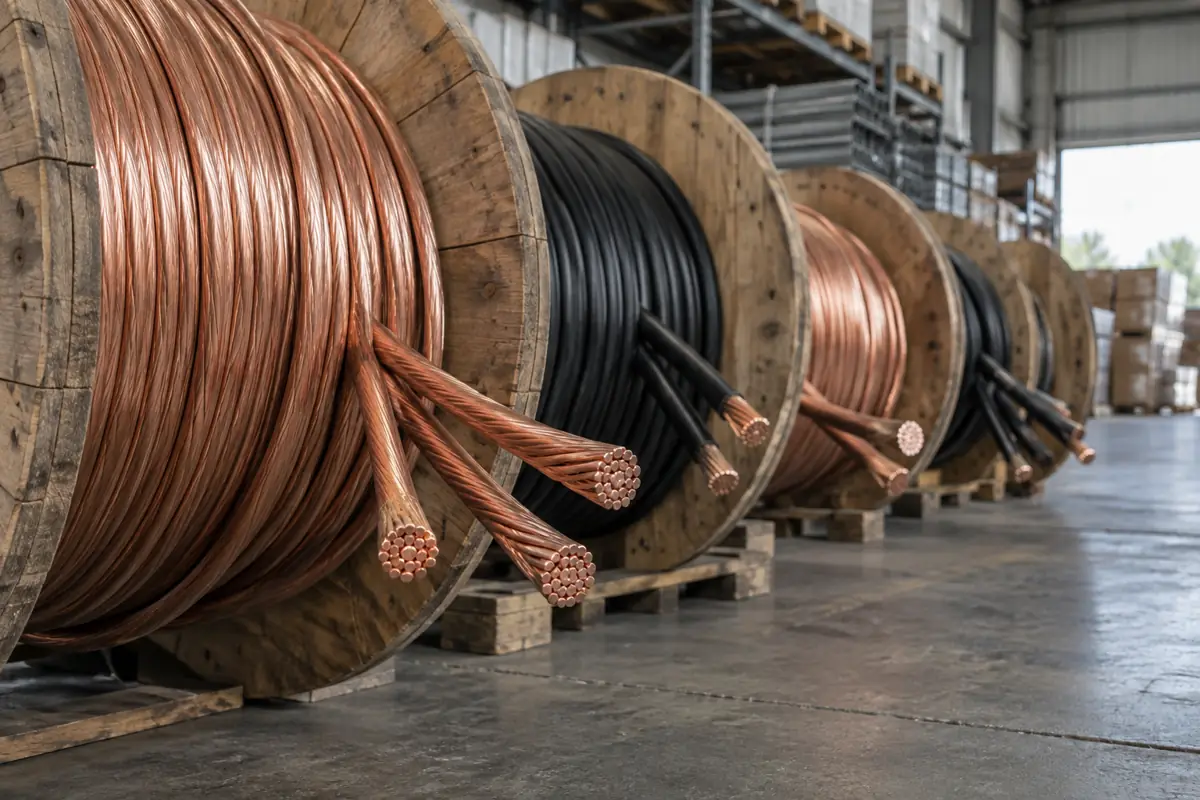
From January 2025 to August 2026, BLS producer prices rose 50.2% for aluminum mill shapes, 45.7% for steel mill products, 44.3% for copper wire and cable and 10.2% for softwood lumber. Untariffed local materials barely moved: ready-mix concrete +1.2%, gypsum products +1.1%, cement -0.4%.
BLS producer price indexes, January 2025 = 100, monthly to August 2026
Source: U.S. Bureau of Labor Statistics, Producer Price Indexes (August 2026 release; May to Aug 2026 preliminary). CB&C rebasing.
The 12-month view to August 2026 tells the same story. Aluminum mill shapes rose 27.3%, copper wire and cable 27.2%, steel mill products 23.4% and copper and brass mill shapes 20.9%. AGC's reading of the same BLS release reports identical metal figures (AGC, 2026-09-10).
Fabricated products rose less than mill products. Fabricated structural metal products rose 13.2% since January 2025, while fabricated bar joists and rebar rose 39.5%. Hot-rolled bars, plates and structural shapes rose 22.8%. For a building owner, the fabricated series is closer to what a steel package costs; see the CB&C commercial construction price index for bid-price context.
| Material | BLS series | Since Jan 2025 | Aug 2025 to Aug 2026 | Since latest tariff action | Latest action |
|---|---|---|---|---|---|
| Aluminum mill shapes | WPU102501 | 50.2 | 27.3 | 5.0 | E5 |
| Steel mill products | WPU1017 | 45.7 | 23.4 | 15.0 | E5 |
| Copper wire and cable | WPU10260314 | 44.3 | 27.2 | 12.2 | E5 |
| Bar joists and rebar (fabricated) | WPU1074051 | 39.5 | 23.6 | 10.1 | E5 |
| Copper and brass mill shapes | WPU102502 | 25.9 | 20.9 | 6.0 | E5 |
| Hot-rolled bars, plates and structural shapes | WPU101704 | 22.8 | 13.4 | 5.9 | E5 |
| Fabricated structural metal products | WPU107 | 13.2 | 6.5 | 2.5 | E5 |
| Plywood | WPU083 | 13.0 | 10.7 | 11.3 | E4 |
| Inputs to nonresidential construction, goods | WPUIP2312001 | 11.5 | 8.8 | ||
| Softwood lumber | WPU0811 | 10.2 | 11.8 | 16.7 | E4 |
| Steel nails and staples | WPU108812 | 9.4 | 6.3 | 6.7 | E5 |
| Construction machinery and equipment | WPU112 | 6.2 | 2.2 | 0.7 | E6 |
| Flat glass | WPU1311 | 5.3 | 2.8 | ||
| Ready-mix concrete | WPU1333 | 1.2 | 2.3 | ||
| Gypsum products | WPU137 | 1.1 | 0.2 | ||
| Insulation materials | WPU1392 | 0.4 | 1.1 | ||
| Cement | WPU1322 | -0.4 | -1.2 |
Latest action codes: E4 lumber 10% (base Sep 2025), E5 metals on full value (base Mar 2026), E6 mobile equipment (base May 2026). Blank means no direct tariff action.
Source: [20] U.S. Bureau of Labor Statistics
Percent change from the last full month before the latest action to August 2026
Source: BLS Producer Price Indexes (August 2026 release). Action dates from the Federal Register.
Since each material's latest tariff action, softwood lumber leads with 16.7% (from September 2025), followed by steel mill products at 15.0% and copper wire at 12.2% (both from March 2026, the month before full-value duties). Aluminum mill shapes rose 5.0% on that basis because they fell 5.9% between June and August 2026.
Did prices jump right after each tariff took effect?
Steel did: steel mill prices rose 21.5% in the 3 months after the 25% tariff returned in March 2025, after falling 3.4% in the 3 months before. Copper and lumber did not: copper wire moved -0.8% and softwood lumber -1.0% in the 3 months after their tariffs began.
Percent change in the targeted BLS producer price index
Source: BLS Producer Price Indexes; effective dates from Proclamations 10896, 10947, 10962, 10976 and 11021.
Aluminum responded to the June 2025 doubling: aluminum mill shapes rose 13.3% in the following 3 months against 3.0% before. Steel's response to the same doubling came early; prices had already climbed 21.5% between February and May 2025 and then eased 5.5% by August 2025.
Copper wire rose 3.7% in the 3 months before the 2025-08-01 copper tariff before the effective date, consistent with buying ahead of the tariff. Softwood lumber fell 5.1% before the 2025-10-14 duty and 1.0% after it, then rose 16.7% by August 2026.
The April 2026 move to full customs value lifted steel mill prices 8.7% and copper wire 7.5% in the next 3 months, after 6.1% and 5.1% in the 3 months before.
| Action | Effective | Material (BLS PPI) | Base month | 3 months before | 3 months after | Base to Aug 2026 |
|---|---|---|---|---|---|---|
| Steel and aluminum 25%, exemptions ended | 2025-03-12 | Steel mill products | Feb 2025 | -3.4 | 21.5 | 41.8 |
| Steel and aluminum 25%, exemptions ended | 2025-03-12 | Hot-rolled bars, plates and structural shapes | Feb 2025 | -5.4 | 6.3 | 24.8 |
| Steel and aluminum 25%, exemptions ended | 2025-03-12 | Bar joists and rebar (fabricated) | Feb 2025 | 2.2 | 10.3 | 35.7 |
| Steel and aluminum 25%, exemptions ended | 2025-03-12 | Aluminum mill shapes | Feb 2025 | 2.0 | 3.0 | 48.6 |
| Steel and aluminum 25%, exemptions ended | 2025-03-12 | Fabricated structural metal products | Feb 2025 | 0.9 | 3.6 | 12.4 |
| Steel and aluminum raised to 50% | 2025-06-04 | Steel mill products | May 2025 | 21.5 | -5.5 | 16.7 |
| Steel and aluminum raised to 50% | 2025-06-04 | Hot-rolled bars, plates and structural shapes | May 2025 | 6.3 | 3.6 | 17.4 |
| Steel and aluminum raised to 50% | 2025-06-04 | Bar joists and rebar (fabricated) | May 2025 | 10.3 | -0.5 | 23.0 |
| Steel and aluminum raised to 50% | 2025-06-04 | Aluminum mill shapes | May 2025 | 3.0 | 13.3 | 44.3 |
| Steel and aluminum raised to 50% | 2025-06-04 | Fabricated structural metal products | May 2025 | 3.6 | 1.8 | 8.4 |
| Copper semi-finished products 50% | 2025-08-01 | Copper and brass mill shapes | Jul 2025 | 3.9 | 1.0 | 22.6 |
| Copper semi-finished products 50% | 2025-08-01 | Copper wire and cable | Jul 2025 | 3.7 | -0.8 | 22.9 |
| Softwood timber and lumber 10% | 2025-10-14 | Softwood lumber | Sep 2025 | -5.1 | -1.0 | 16.7 |
| Softwood timber and lumber 10% | 2025-10-14 | Plywood | Sep 2025 | 0.2 | -0.1 | 11.3 |
| Metals tariffs on full customs value | 2026-04-06 | Steel mill products | Mar 2026 | 6.1 | 8.7 | 15.0 |
| Metals tariffs on full customs value | 2026-04-06 | Aluminum mill shapes | Mar 2026 | 10.2 | 11.6 | 5.0 |
| Metals tariffs on full customs value | 2026-04-06 | Copper and brass mill shapes | Mar 2026 | 7.6 | 5.5 | 6.0 |
| Metals tariffs on full customs value | 2026-04-06 | Copper wire and cable | Mar 2026 | 5.1 | 7.5 | 12.2 |
| Metals tariffs on full customs value | 2026-04-06 | Fabricated structural metal products | Mar 2026 | 1.9 | 1.1 | 2.5 |
| Mobile industrial equipment 25% (to 2027) | 2026-06-08 | Construction machinery and equipment | May 2026 | 0.3 | 0.7 | 0.7 |
Base month is the last full month before the effective date. PPI for May to Aug 2026 is preliminary. Other forces (global metal prices, demand, energy) act in the same windows.
Source: [20] U.S. Bureau of Labor Statistics
Why are domestic prices rising faster than import prices?
Because the duty sits between the two. BLS import price indexes exclude duties, and from February 2025 to August 2026 domestic steel mill prices rose 41.8% while import prices for iron and steel mill products fell 3.5%, a 45.3-point gap. Aluminum shows a 28.0-point gap; copper wire shows almost none (-0.5 points).
Import price index (duty excluded): BLS measures import prices at the foreign port or U.S. border before duties are added. A tariff that foreign sellers do not absorb leaves the import index flat while U.S. buyers pay more; a domestic producer price index then captures what U.S. mills charge behind the tariff wall.
Steel mill products PPI vs import price index for iron and steel mill products (duty excluded), January 2025 = 100
Source: BLS Producer Price Index WPU1017 and Import Price Index EIUIR141 (August 2026 releases). CB&C rebasing.
BLS states that the prices used for its import indexes exclude duties (BLS). Its handbook gives the logic: if a 10% duty is imposed and the foreign seller absorbs half, the duty-excluded index falls about 5% while a duty-inclusive measure would rise 5% (BLS Handbook of Methods).
Percent change February 2025 to August 2026
Source: BLS Producer Price Indexes and Import Price Indexes (August 2026 releases). Pairs listed in table t3.
| Material pair | PPI series | Import price series | PPI change | Import price change | Gap (points) |
|---|---|---|---|---|---|
| Steel mill products | WPU1017 | EIUIR141 | 41.8 | -3.5 | 45.3 |
| Fabricated structural metal vs articles of iron or steel | WPU107 | EIUIP73 | 12.4 | 2.4 | 10.0 |
| Aluminum mill shapes vs aluminum and articles | WPU102501 | EIUIP76 | 48.6 | 20.6 | 28.0 |
| Copper wire and cable vs copper and articles | WPU10260314 | EIUIP74 | 41.8 | 42.3 | -0.5 |
| Softwood lumber vs sawn wood | WPU0811 | EIUIP4407 | 7.3 | -2.6 | 9.9 |
| Cement | WPU1322 | EIUIP2523 | -0.2 | -6.5 | 6.3 |
| Construction machinery | WPU112 | EIUIR21030 | 6.0 | 2.8 | 3.2 |
BLS import price indexes exclude duties, so the gap approximates how far domestic prices moved relative to foreign sellers' pre-duty prices. Product mixes of each pair differ.
Source: [20][21][23] U.S. Bureau of Labor Statistics; U.S. Bureau of Labor Statistics; U.S. Bureau of Labor Statistics
The pattern splits the materials into two groups. Steel (45.3 points), aluminum (28.0 points), fabricated steel (10.0 points) and softwood lumber (9.9 points) show domestic prices pulling away from pre-duty import prices, the signature of a tariff passed through to U.S. buyers. Copper wire shows no gap: import prices for copper and articles rose 42.3%, so the world copper price, not the U.S. duty, explains the increase.
This comparison does not re-run the CB&C margin squeeze index, which tracks bid prices against costs; that measure is on the CB&C commercial construction price index.
What is the tariff on lumber in 2026?
10% under Section 232 on all softwood timber and lumber imports since 2025-10-14, plus antidumping and countervailing duties on Canadian lumber: 45.16% in total for Canadian mills not individually reviewed (20.53% AD, 14.63% CVD, 10% Section 232).
Proclamation 10976 set 10% on softwood timber and lumber, 25% on kitchen cabinets and vanities (including parts) and 25% on certain upholstered wooden products from 2025-10-14. It caps wood product tariffs at 15% including the normal duty for the European Union and Japan and at 10% for the United Kingdom (90 FR 48127). Proclamation 11000 pushed the scheduled rise to 50% for cabinets and vanities and 30% for upholstered products from 2026-01-01 to 2027-01-01 (91 FR 1039).
Canadian lumber also pays trade-remedy duties. Commerce's amended 2023 review set 20.53% antidumping for non-selected firms (90 FR 44035) and its 2023 countervailing review set 14.63% (90 FR 38755). Together with Section 232 that is 45.16%. NAHB rounds the same stack to about 45% (NAHB).
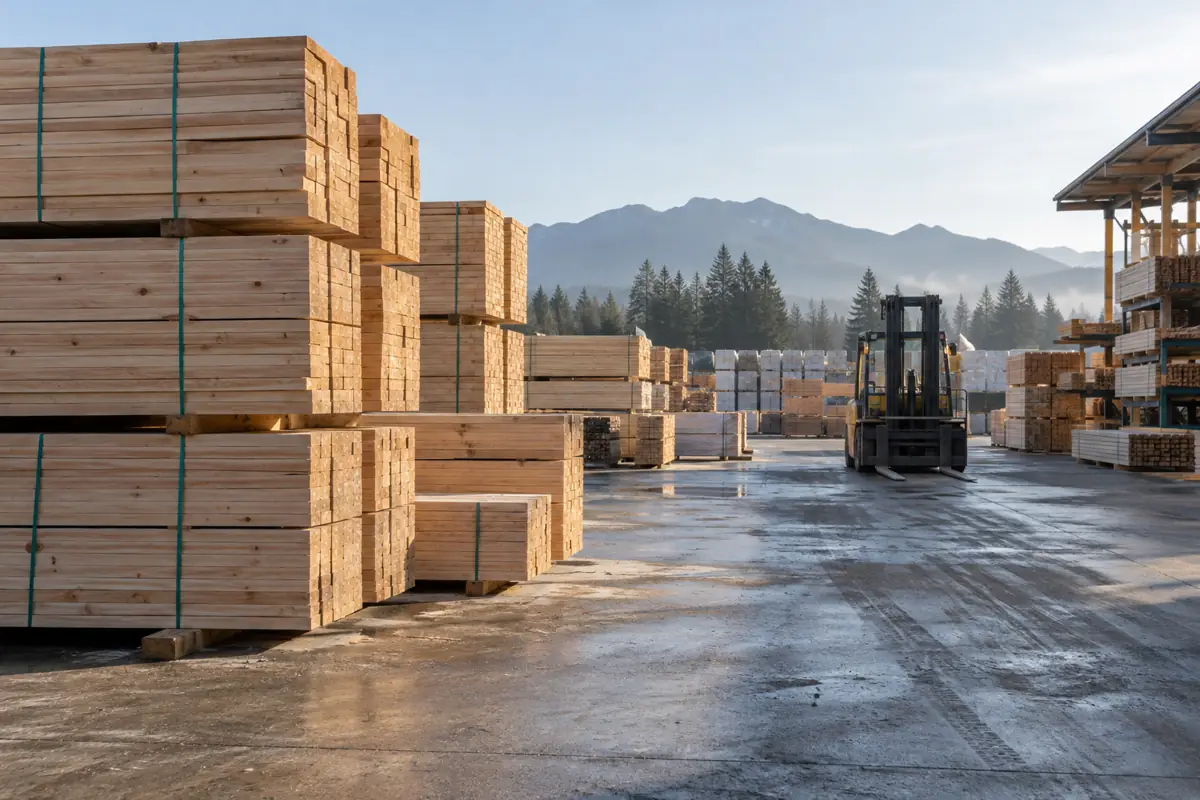
Prices: softwood lumber producer prices fell 5.5% between January and September 2025, then rose 16.7% from September 2025 to August 2026, including a 1.9% dip in August. Plywood rose 11.3% over the same 11 months.
Which construction materials are imported, and from where?
Aluminum and copper are the most import-dependent: U.S. net import reliance was an estimated 60% for aluminum and 57% for refined copper in 2025, against 21% for cement, 15% for gypsum and 13% for steel mill products (USGS). Canada is the top source for aluminum, steel and lumber.
| Material | 2025 (est.) | 2024 | Main import sources (2021 to 2024) | Construction link | Source |
|---|---|---|---|---|---|
| Aluminum | 60 | 62 | Canada 56%, United Arab Emirates 8%, Bahrain 4% | Building 13% of consumption | USGS MCS 2026 |
| Copper (refined) | 57 | 45 | Ore and concentrate: Canada over 99% | Building construction 42% of copper product use | USGS MCS 2026 |
| Cement | 21 | 22 | Turkey 32%, Canada 20%, Vietnam 13% | Ready-mix producers take most shipments | USGS MCS 2026 |
| Gypsum | 15 | 16 | Spain 38%, Mexico 30%, Canada 28% | Demand depends mainly on construction activity | USGS MCS 2026 |
| Steel mill products | 13 | 14 | Canada 23%, Mexico 15%, Brazil 13% | Construction 31% of net shipments | USGS MCS 2026 |
| Softwood lumber | n/a | n/a | Canada roughly 85% of imports | Canada almost one-quarter of U.S. supply | NAHB (Tier 2) |
USGS net import reliance is imports minus exports adjusted for stocks; Commerce cites a gross steel import share of nearly 30% for 2024. Lumber has no USGS chapter.
Source: [27][28][29][30][31][34][1] U.S. Geological Survey; U.S. Geological Survey; U.S. Geological Survey; U.S. Geological Survey; U.S. Geological Survey; National Association of Home Builders; Executive Office of the President, Federal Register
Net import reliance understates how much steel crosses the border. Commerce, in Proclamation 10896, put total steel imports at nearly 30% of U.S. consumption in 2024, a gross measure; the USGS net figure for 2024 is 14% (USGS). Construction took an estimated 31% of U.S. steel net shipments in 2025.
Canada supplied 56% of U.S. aluminum imports and 23% of steel imports from 2021 to 2024 (USGS), and roughly 85% of softwood lumber imports according to NAHB. Copper reliance jumped from 45% in 2024 to an estimated 57% in 2025, the largest one-year change among these materials (USGS).
Are steel tariffs raising building prices?
Yes for materials, less for whole buildings: steel mill prices rose 45.7% and fabricated structural metal 13.2% from January 2025 to August 2026, while the BLS index of goods inputs to nonresidential construction rose 11.5%. AISC puts the steel frame at around 12% of project cost.
Prices for inputs to new nonresidential construction rose 8.9% in the 12 months to August 2026 on CB&C's reading of the BLS series, matching AGC's 8.9% headline. ABC reports nonresidential input prices 8.8% above a year earlier (ABC, 2026-09-10). Energy, not only metals, drove that figure: AGC cites diesel and asphalt alongside tariffed metals.
Trade bodies frame the building-level effect differently. AISC says material is less than one-third of framing system cost and the frame is around 12% of project cost, so a 5% steel price rise is less than one-fifth of 1% of total project cost (AISC). Cushman & Wakefield estimated in April 2026 that tariff rates then in force add 6.0% to construction materials costs and 3.0% to total project costs relative to 2024 (Cushman & Wakefield). Both are modeled estimates, not measured outcomes.
For per-square-foot budgets by building type, see commercial construction cost per square foot.
Will construction material prices go down?
The data show no broad decline yet: in August 2026 steel mill prices rose 1.7% on the month and copper and brass mill shapes rose 3.5%, while aluminum mill shapes fell 5.9% from June and softwood lumber 1.9% on the month. Scheduled tariff dates point both ways.
- 2027-01-01: kitchen cabinets and vanities scheduled to rise from 25% to 50%; upholstered wood products from 25% to 30% (Proclamation 11000).
- 2028-01-01: the temporary 15% total duty on fixed industrial machinery and power equipment, and the 15% partner rate on mobile industrial equipment, end; the 25% derivative rate in clause 3 of Proclamation 11021 applies instead (Proclamations 11021 and 11032).
- Refined copper: Commerce recommended a phased duty of 15% from 2027-01-01 and 30% from 2028-01-01; no proclamation imposing it was found as of 2026-10-08 (Proclamation 10962).
- Canadian lumber: final 2024 review rates are pending; the preliminary rates would lower the combined lumber duty from 45.16% to 34.83%.
This section reports data and scheduled dates only. It is not a price forecast and not purchasing advice. The next BLS readings arrive on 2026-10-15 (producer prices) and 2026-10-16 (import prices).
The numbers in one list
- Since 2026-04-06, Section 232 duties on U.S. imports of aluminum, steel and copper articles and their derivatives apply to the full customs value of the product, regardless of metal content.[9]
- Under Proclamation 11021, U.S. imports of aluminum and steel articles, most copper articles and certain derivatives pay 50%; Annex I-B derivatives pay 25%; derivatives made entirely from U.S.-melted metal pay 10%.[9]
- Softwood timber and lumber imported into the United States has paid a 10% Section 232 duty since 2025-10-14; kitchen cabinets and vanities pay 25%, with 50% now scheduled for 2027-01-01.[5][6]
- U.S. producer prices for aluminum mill shapes rose 50.2% from January 2025 to August 2026, the largest increase among the construction materials tracked here.[20]
- U.S. producer prices for steel mill products rose 45.7% from January 2025 to August 2026 and 23.4% in the 12 months to August 2026.[20]
- U.S. steel mill prices rose 21.5% in the 3 months after the 2025-03-12 restoration of the 25% tariff, after falling 3.4% in the 3 months before.[20][1]
- From February 2025 to August 2026, U.S. domestic steel mill prices rose 41.8% while duty-excluded import prices for iron and steel mill products fell 3.5%.[20][21][23]
- U.S. aluminum mill shape prices rose 48.6% from February 2025 to August 2026, 28.0 points more than duty-excluded import prices for aluminum and articles (+20.6%).[20][21]
- U.S. copper wire and cable prices (+41.8%) and import prices for copper and articles (+42.3%) rose almost equally from February 2025 to August 2026.[20][21]
- U.S. softwood lumber producer prices rose 16.7% from September 2025, the month before the 10% Section 232 duty, to August 2026, the largest move since any material's latest tariff action.[20][5]
- Non-selected Canadian softwood lumber mills face 45.16% in combined U.S. duties: 35.16% antidumping and countervailing plus 10% under Section 232.[16][17][5]
- Metal mill products, wire and fabricated metal carry 17.7% of the BLS input index for new U.S. construction (May 2026 weights); softwood lumber carries 1.26%.[22]
- The United States relied on net imports for an estimated 60% of aluminum, 57% of refined copper, 21% of cement and 13% of steel mill products consumed in 2025 (USGS).[27][28][29][30]
- U.S. ready-mix concrete producer prices rose 1.2% and cement prices fell 0.4% from January 2025 to August 2026, showing that untariffed local materials stayed flat.[20]
Calculations
Event windows around each tariff action
FormulaIndex(base + 3 months) / Index(base) - 1, and Index(base) / Index(base - 3 months) - 1, where base is the last full month before the effective date
Inputs: BLS PPI index levels, fact sheet rows listed in derived_metrics.csv (ev_*) (fact sheet rows)
Result: Steel mill: -3.4% before, 21.5% after (Mar 2025). Aluminum mill: 3.0% before, 13.3% after (Jun 2025). Copper wire: 3.7% before, -0.8% after (Aug 2025). Softwood lumber: -5.1% before, -1.0% after (Oct 2025).
Steel and aluminum show clear post-action jumps; copper and lumber do not, which fits copper's global price drive and lumber's demand-led swings.
Limitations: Three months is short; overlapping actions (March and June 2025) blur steel; anticipatory buying shifts moves before effective dates.
Domestic-minus-import price gap
FormulaPPI % change minus duty-excluded import price % change, February 2025 to August 2026
Inputs: BLS PPI and import price index levels, rows listed in derived_metrics.csv (gap_*) (fact sheet rows)
Result: Steel 45.3 points; aluminum 28.0; fabricated steel 10.0; softwood lumber 9.9; cement 6.3; construction machinery 3.2; copper wire -0.5.
Large positive gaps indicate U.S. prices rising behind the duty while foreign pre-duty prices held or fell; a near-zero gap (copper) indicates a world price move.
Limitations: Paired indexes cover different product mixes (for example HS 74 includes refined copper and scrap); PPI for May to Aug 2026 is preliminary.
Ranking of price change since the latest tariff action
FormulaIndex(Aug 2026) / Index(last full month before latest action) - 1
Inputs: BLS PPI levels; action dates from Proclamations 10976, 11021, 11032 (fact sheet rows)
Result: Softwood lumber 16.7%, steel mill 15.0%, copper wire 12.2%, plywood 11.3%, aluminum mill 5.0%, fabricated structural metal 2.5%, construction machinery 0.7%.
Lumber's ranking reflects an 11-month window against 5 months for metals; per month, steel's rise since March 2026 is the steepest.
Limitations: Windows differ in length by material.
Share of new-construction input costs reached by Section 232
FormulaSum of BLS relative importance weights within IN231 by commodity-code group (scripts/weights.py)
Inputs: BLS input price index relative importance table, May 2026 sheet; groups in table t5 (fact sheet rows)
Result: Direct metal and lumber categories 19.0%; including metal-containing equipment 28.1%; all other inputs 71.9%.
Roughly one dollar in five of purchased inputs (excluding labor) is in a directly tariffed category; the rest is mostly local concrete, aggregates, energy and services.
Limitations: Covers all new construction, not nonresidential only; commodity codes do not map one-to-one to tariff lines; domestic items are counted because their prices move with the tariff.
Combined duty on Canadian softwood lumber
FormulaAD non-selected rate + CVD non-selected rate + Section 232 rate
Inputs: Fact sheet rows for 90 FR 44035, 90 FR 38755 and 90 FR 48127 (fact sheet rows)
Result: 45.16% (current); 34.83% if preliminary 2024 rates become final.
Canadian lumber pays more than four times the 10% headline Section 232 rate.
Limitations: Firm-specific rates differ; normal MFN duty not included; Section 338 coverage of lumber not confirmed.
Questions people ask
How do tariffs affect construction costs?
Mostly through metals. From January 2025 to August 2026, BLS producer prices rose 45.7% for steel mill products and 50.2% for aluminum mill shapes, while the index of goods inputs to nonresidential construction rose 11.5%. Metal and lumber categories hit directly by Section 232 carry 19.0% of the BLS new-construction input weight.
Are steel tariffs raising building prices?
They are raising steel prices: domestic steel mill prices rose 41.8% from February 2025 to August 2026 while duty-excluded import prices fell 3.5%. Fabricated structural metal rose 13.2% since January 2025. AISC estimates the frame is around 12% of project cost.
What is the tariff on lumber in 2026?
10% under Section 232 on softwood timber and lumber since 2025-10-14. Canadian lumber from non-selected mills also pays 20.53% antidumping and 14.63% countervailing duty, 45.16% in total. Kitchen cabinets and vanities pay 25%, rising to 50% on 2027-01-01.
Which construction materials are imported?
By USGS estimates for 2025, net imports supplied 60% of U.S. aluminum, 57% of refined copper, 21% of cement, 15% of gypsum and 13% of steel mill products. NAHB says Canada provides roughly 85% of U.S. softwood lumber imports.
Will construction material prices go down?
No broad decline shows in the data yet. Steel mill prices rose 1.7% in August 2026; aluminum mill shapes fell 5.9% from June to August 2026 and softwood lumber fell 1.9% in August. Cabinet and vanity tariffs are scheduled to rise on 2027-01-01.
Summary
- Section 232 is the main tariff on U.S. building inputs in 2026: 50% on steel, aluminum and most copper articles, 25% on listed metal derivatives, and 10% on softwood lumber (Federal Register, Proclamations 11021 and 10976).
- From January 2025 to August 2026, BLS producer prices rose 50.2% for aluminum mill shapes, 45.7% for steel mill products and 44.3% for copper wire and cable, against 1.2% for ready-mix concrete.
- Domestic steel mill prices rose 41.8% from February 2025 to August 2026 while duty-excluded import prices for iron and steel mill products fell 3.5%, a gap of 45.3 points that points to the duty, not foreign prices, as the driver.
- Copper is the exception: copper wire prices (+41.8%) moved in line with import prices for copper and articles (+42.3%), so global copper prices explain most of that rise.
- Canadian softwood lumber from non-selected mills carries 45.16% in combined U.S. duties: 20.53% antidumping, 14.63% countervailing and the 10% Section 232 tariff.
- About 19.0% of the BLS input bill for new construction sits in metal and lumber categories reached directly by Section 232; including metal-containing equipment the share is 28.1%.
- IEEPA tariffs ended on 2026-02-20, and the 10% Section 122 surcharge that replaced them excluded the Section 232 portion of imports and expired on 2026-07-24, so Section 232 remains the operative rate for metals.
Frequently asked questions
What is the tariff on imported steel for construction in 2026?
50% under Section 232 for steel articles and listed derivatives, charged on full customs value since 2026-04-06; 25% for qualifying UK steel and 10% for derivatives made entirely from U.S.-melted steel (Proclamation 11021).
What is the tariff on aluminum building products?
50% for aluminum articles and Annex I-A derivatives and 25% for Annex I-B derivatives under Proclamation 11021. Approved primary aluminum onshoring plans can import set quantities at half the rate (Proclamation 11045).
Is copper wire subject to tariffs?
Yes. Semi-finished copper products and intensive copper derivatives have paid 50% since 2025-08-01, on full value since 2026-04-06. U.S. copper wire and cable prices rose 44.3% from January 2025 to August 2026.
Do tariffs apply to the whole product or only the metal content?
Since 2026-04-06, Section 232 duties on aluminum, steel and copper articles and derivatives apply to the full customs value regardless of metal content. Before that, derivative duties applied to metal content only.
Are construction machinery imports tariffed?
Mobile industrial equipment pays a 25% Section 232 duty from 2026-06-08 through 2027-12-31, or 15% in total for listed partners (Proclamation 11032). BLS prices for construction machinery rose 6.2% from January 2025 to August 2026.
Did the 10% Section 122 surcharge add to steel tariffs?
No. Proclamation 11012 excluded the part of an import covered by Section 232 tariffs, and the surcharge ran only from 2026-02-24 to 2026-07-24.
Is there a tariff on quartz countertops?
Quartz surface products have been under a 4-year safeguard tariff-rate quota since 2026-08-15 (Proclamation 11051). Imports from Canada, Mexico, Korea and several other trade partners are excluded.
Do BLS import price indexes include tariffs?
No. BLS says the prices behind its import indexes exclude duties, which is why this report compares them with domestic producer prices.
Which building materials have not risen much?
Locally produced, untariffed materials: from January 2025 to August 2026 ready-mix concrete rose 1.2%, gypsum products 1.1% and insulation 0.4%, and cement fell 0.4%.
When will new price data be released?
BLS publishes September 2026 producer prices on 2026-10-15 and import prices on 2026-10-16. This report uses the August 2026 releases of 2026-09-10 and 2026-09-16.
Download the data
Every table in this report is available as a CSV under CC BY 4.0. The fact sheet lists each value with its source URL and access date.
- derived_metrics.csv (CSV)
- fact_sheet.csv (CSV)
- Tariff actions affecting construction materials, March 2025 to September 2026 (CSV)
- Event windows: producer price change 3 months before and after each tariff action (percent) (CSV)
- Domestic producer prices vs import prices, February 2025 to August 2026 (percent change) (CSV)
- Construction material producer price changes ranked, to August 2026 (percent) (CSV)
- Share of new-construction input costs reached by Section 232 tariffs (BLS weights, May 2026) (CSV)
- How import-dependent are key construction materials? (net import reliance, percent of apparent consumption) (CSV)
For journalists and researchers
If you cite only a few, cite these
- U.S. steel mill product prices: +45.7% from January 2025 to August 2026 (BLS PPI WPU1017).[20]
- Domestic vs import steel price gap: 45.3 points since February 2025 (BLS PPI and Import Price Indexes).[20][21]
- Section 232 duty of 50% on steel, aluminum and most copper articles, on full customs value since 2026-04-06 (Proclamation 11021).[9]
Most quotable statistics
- U.S. producer prices for steel mill products rose 45.7% from January 2025 to August 2026 (BLS).[20]
- From February 2025 to August 2026, domestic U.S. steel mill prices rose 41.8% while duty-excluded import prices for iron and steel mill products fell 3.5% (BLS).[20][21]
- U.S. aluminum mill shape prices rose 50.2% from January 2025 to August 2026, the largest increase among the 17 BLS construction price series tracked in this report.[20]
- Canadian softwood lumber from non-selected mills faces 45.16% in combined U.S. duties in 2026 (Commerce; Proclamation 10976).[16][17][5]
- About 19.0% of U.S. new-construction input costs, excluding labor, fall in metal and lumber categories reached directly by Section 232 tariffs (BLS weights, May 2026).[22]
- U.S. copper wire prices rose 41.8% from February 2025 to August 2026, almost exactly matching import prices for copper (+42.3%), pointing to world copper prices rather than the tariff (BLS).[20][21]
Press summary
A Commercial Builders & Contractors analysis of Federal Register proclamations and Bureau of Labor Statistics price data finds that Section 232 tariffs are the main tariffs on construction materials in 2026: 50% on steel, aluminum and most copper articles, charged on full customs value since April 6, 25% on many metal derivatives and 10% on softwood lumber. From January 2025 to August 2026, U.S. producer prices rose 50.2% for aluminum mill shapes, 45.7% for steel mill products and 44.3% for copper wire, while ready-mix concrete rose 1.2%. Domestic steel prices rose 41.8% since February 2025 as duty-excluded import prices fell 3.5%, a gap that points to the tariff as the driver; copper showed no such gap. Canadian softwood lumber faces 45.16% in combined duties. Metal and lumber categories hit directly by Section 232 make up about 19.0% of new-construction input costs, excluding labor.
Suggested headlines
- Steel prices up 45.7% since tariffs returned, while import prices fell
- Aluminum mill prices climb 50.2% under the 50% Section 232 tariff
- Canadian lumber now pays 45.16% in U.S. duties
- Tariffs reach about 19.0% of the materials bill for new construction
- Copper's price surge tracks world markets more than the U.S. tariff, BLS data show
How to cite this report
Commercial Builders & Contractors. (2026). Tariffs on Construction Materials in 2026: What Applies and How Prices Moved. Retrieved from https://commercialbuildersandcontractors.com/construction-material-tariffs/
Reuse license
Data and tables are licensed CC BY 4.0. Attribution: “Source: Commercial Builders & Contractors, Tariffs on Construction Materials in 2026: What Applies and How Prices Moved” with a link to this page.
Methodology
Source selection: tariff rates come only from official documents published in the Federal Register (presidential proclamations, an executive order, a USTR notice and Commerce antidumping and countervailing duty notices), read in full text on govinfo.gov. Rates are quoted as officially stated. Prices come from BLS Producer Price Index and Import Price Index flat files (download.bls.gov), August 2026 releases of 2026-09-10 and 2026-09-16, and import dependence from USGS Mineral Commodity Summaries 2026. Trade-body material (AGC, ABC, NAHB, AISC, Cushman & Wakefield) is used for headline figures only and labelled Tier 2.
Inclusion and exclusion: included are actions that set or change a duty on a construction input (metals, lumber, cabinets, quartz, machinery, Canadian goods under Section 338). Excluded are investigations without a duty (processed critical minerals, Proclamation 11001), actions on non-construction goods (autos, aircraft, drones, pharmaceuticals, polysilicon), and claims we could not confirm in official text, listed in excluded.md. The Federal Register was searched on 2026-10-08.
Conflicting numbers: the steel import share differs by definition (Commerce gross share of nearly 30% for 2024 vs USGS net import reliance of 14%); both are shown with their definitions. AGC and ABC year-over-year figures were checked against our own calculation from the same BLS series and match.
Derived metrics: event windows compare the 3 months before and after the last full month before each effective date; gaps subtract the duty-excluded import price change from the PPI change over February 2025 to August 2026; rankings use August 2026 against January 2025, August 2025 and the month before each material's latest action; the cost share sums BLS May 2026 weights by commodity-code group. All inputs, formulas and results are in derived_metrics.csv and reproducible with scripts/extract_bls.py, weights.py and compute.py.
Limitations: PPI data for May to August 2026 are preliminary and will be revised. Price indexes are national, not regional, and are not seasonally adjusted. Event windows show timing, not causation. Paired PPI and import series cover different product mixes. The input-weight share covers all new construction and excludes labor and capital. Section 338 annex product lists and quartz safeguard rates are published as images and were not parsed.
Last updated 2026-10-08. Next scheduled update after the BLS releases of 2026-10-15 and 2026-10-16. This report is not legal, tax or purchasing advice; confirm the duty for a specific product with its HTSUS classification and U.S. Customs and Border Protection guidance.
This report presents published data with its limitations. It is not legal, financial or investment advice.
Sources, ranked by quality
Tier 1: primary and official sources (31)
- [1] Executive Office of the President, Federal Register. Proclamation 10896, Adjusting Imports of Steel Into the United States (90 FR 9817). Signed 2025-02-10. Accessed 2026-10-08.
- [2] Executive Office of the President, Federal Register. Proclamation 10895, Adjusting Imports of Aluminum Into the United States (90 FR 9807). Signed 2025-02-10. Accessed 2026-10-08.
- [3] Executive Office of the President, Federal Register. Proclamation 10947, Adjusting Imports of Aluminum and Steel Into the United States (90 FR 24199). Signed 2025-06-03. Accessed 2026-10-08.
- [4] Executive Office of the President, Federal Register. Proclamation 10962, Adjusting Imports of Copper Into the United States (90 FR 37727). Signed 2025-07-30. Accessed 2026-10-08.
- [5] Executive Office of the President, Federal Register. Proclamation 10976, Adjusting Imports of Timber, Lumber, and Their Derivative Products (90 FR 48127). Signed 2025-09-29. Accessed 2026-10-08.
- [6] Executive Office of the President, Federal Register. Proclamation 11000, Amendments to Adjusting Imports of Timber, Lumber, and Their Derivative Products (91 FR 1039). Signed 2025-12-31. Accessed 2026-10-08.
- [7] Executive Office of the President, Federal Register. Executive Order 14389, Ending Certain Tariff Actions (91 FR 9437). Signed 2026-02-20. Accessed 2026-10-08.
- [8] Executive Office of the President, Federal Register. Proclamation 11012, Imposing a Temporary Import Surcharge (91 FR 9339). Signed 2026-02-20. Accessed 2026-10-08.
- [9] Executive Office of the President, Federal Register. Proclamation 11021, Strengthening Actions Taken To Adjust Imports of Aluminum, Steel, and Copper (91 FR 18201). Signed 2026-04-02. Accessed 2026-10-08.
- [10] Executive Office of the President, Federal Register. Proclamation 11032, Further Adjusting the Tariff Regimes for Imports of Aluminum, Steel, and Copper (91 FR 34085). Signed 2026-06-01. Accessed 2026-10-08.
- [11] Executive Office of the President, Federal Register. Proclamation 11045, Further Strengthening Actions Taken To Adjust Imports of Aluminum (91 FR 46635). Signed 2026-07-20. Accessed 2026-10-08.
- [12] Office of the U.S. Trade Representative, Federal Register. Notice of Actions in Section 301 Investigations Related to Forced Labor Import Prohibitions (91 FR 47318). Published 2026-07-28. Accessed 2026-10-08.
- [13] Executive Office of the President, Federal Register. Proclamation 11048, Imposing Additional Duties To Offset Canadian Discrimination, Motor Vehicles (91 FR 46663). Signed 2026-07-20. Accessed 2026-10-08.
- [14] Executive Office of the President, Federal Register. Proclamation 11065, Modifying the Scope of Products of Canada Subject to the Additional Duties, Motor Vehicles (91 FR 58339). Signed 2026-09-08. Accessed 2026-10-08.
- [15] Executive Office of the President, Federal Register. Proclamation 11051, To Facilitate Positive Adjustment to Competition From Imports of Quartz Surface Products (91 FR 50645). Signed 2026-07-31. Accessed 2026-10-08.
- [16] U.S. Department of Commerce, International Trade Administration. Certain Softwood Lumber Products From Canada: Amended Final Results of Antidumping Duty Administrative Review; 2023 (90 FR 44035). Period of review 2023. Accessed 2026-10-08.
- [17] U.S. Department of Commerce, International Trade Administration. Certain Softwood Lumber Products From Canada: Final Results of the Countervailing Duty Administrative Review; 2023 (90 FR 38755). Period of review 2023. Accessed 2026-10-08.
- [18] U.S. Department of Commerce, International Trade Administration. Certain Softwood Lumber From Canada: Preliminary Results of Antidumping Duty Administrative Review; 2024 (91 FR 19102). Period of review 2024. Accessed 2026-10-08.
- [19] U.S. Department of Commerce, International Trade Administration. Certain Softwood Lumber Products From Canada: Preliminary Results of Countervailing Duty Administrative Review; 2024 (91 FR 19099). Period of review 2024. Accessed 2026-10-08.
- [20] U.S. Bureau of Labor Statistics. Producer Price Index commodity data, flat files wp.data.9, 11a, 11b, 12a, 14, 80i (August 2026 release). Jan 2025 to Aug 2026 (May to Aug 2026 preliminary). Accessed 2026-10-08.
- [21] U.S. Bureau of Labor Statistics. Import Price Indexes, flat files ei.data.01 (BEA end use), 03 (NAICS), 05 (Harmonized System), August 2026 release. Jan 2025 to Aug 2026. Accessed 2026-10-08.
- [22] U.S. Bureau of Labor Statistics. Input price index relative importance table (May 2026 weights). Weights as of May 2026. Accessed 2026-10-08.
- [23] U.S. Bureau of Labor Statistics. Import/Export Price Indexes: Questions and Answers. Current. Accessed 2026-10-08.
- [24] U.S. Bureau of Labor Statistics. Handbook of Methods: International Price Program, Concepts. Current. Accessed 2026-10-08.
- [25] U.S. Bureau of Labor Statistics. Producer Price Index release schedule. 2026 schedule. Accessed 2026-10-08.
- [26] U.S. Bureau of Labor Statistics. U.S. Import and Export Price Indexes release schedule. 2026 schedule. Accessed 2026-10-08.
- [27] U.S. Geological Survey. Mineral Commodity Summaries 2026: Iron and Steel. 2021 to 2025 (2025 estimated). Accessed 2026-10-08.
- [28] U.S. Geological Survey. Mineral Commodity Summaries 2026: Aluminum. 2021 to 2025 (2025 estimated). Accessed 2026-10-08.
- [29] U.S. Geological Survey. Mineral Commodity Summaries 2026: Copper. 2021 to 2025 (2025 estimated). Accessed 2026-10-08.
- [30] U.S. Geological Survey. Mineral Commodity Summaries 2026: Cement. 2021 to 2025 (2025 estimated). Accessed 2026-10-08.
- [31] U.S. Geological Survey. Mineral Commodity Summaries 2026: Gypsum. 2021 to 2025 (2025 estimated). Accessed 2026-10-08.
Tier 2: trade bodies, market research, company data (6)
- [32] Associated General Contractors of America. Construction Input Costs Climb 8.9% Between August 2025 And August 2026 (news release, 2026-09-10). Aug 2025 to Aug 2026. Accessed 2026-10-08.
- [33] Associated Builders and Contractors. ABC: Construction Materials Prices Jump Again in August (news release, 2026-09-10). Aug 2026. Accessed 2026-10-08.
- [34] National Association of Home Builders. How Tariffs Impact the Home Building Industry. 2025 to 2026. Accessed 2026-10-08.
- [35] Cushman & Wakefield. The Impact of Tariffs on U.S. CRE Construction Costs (2026-04-08). Tariff rates as of 2026-04-07. Accessed 2026-10-08.
- [36] American Institute of Steel Construction. Tariffs (economic data page). Current. Accessed 2026-10-08.
- [37] Associated General Contractors of America. Tariff Resource Center for Contractors (updated 2026-09-24). As of 2026-09-24. Accessed 2026-10-08.