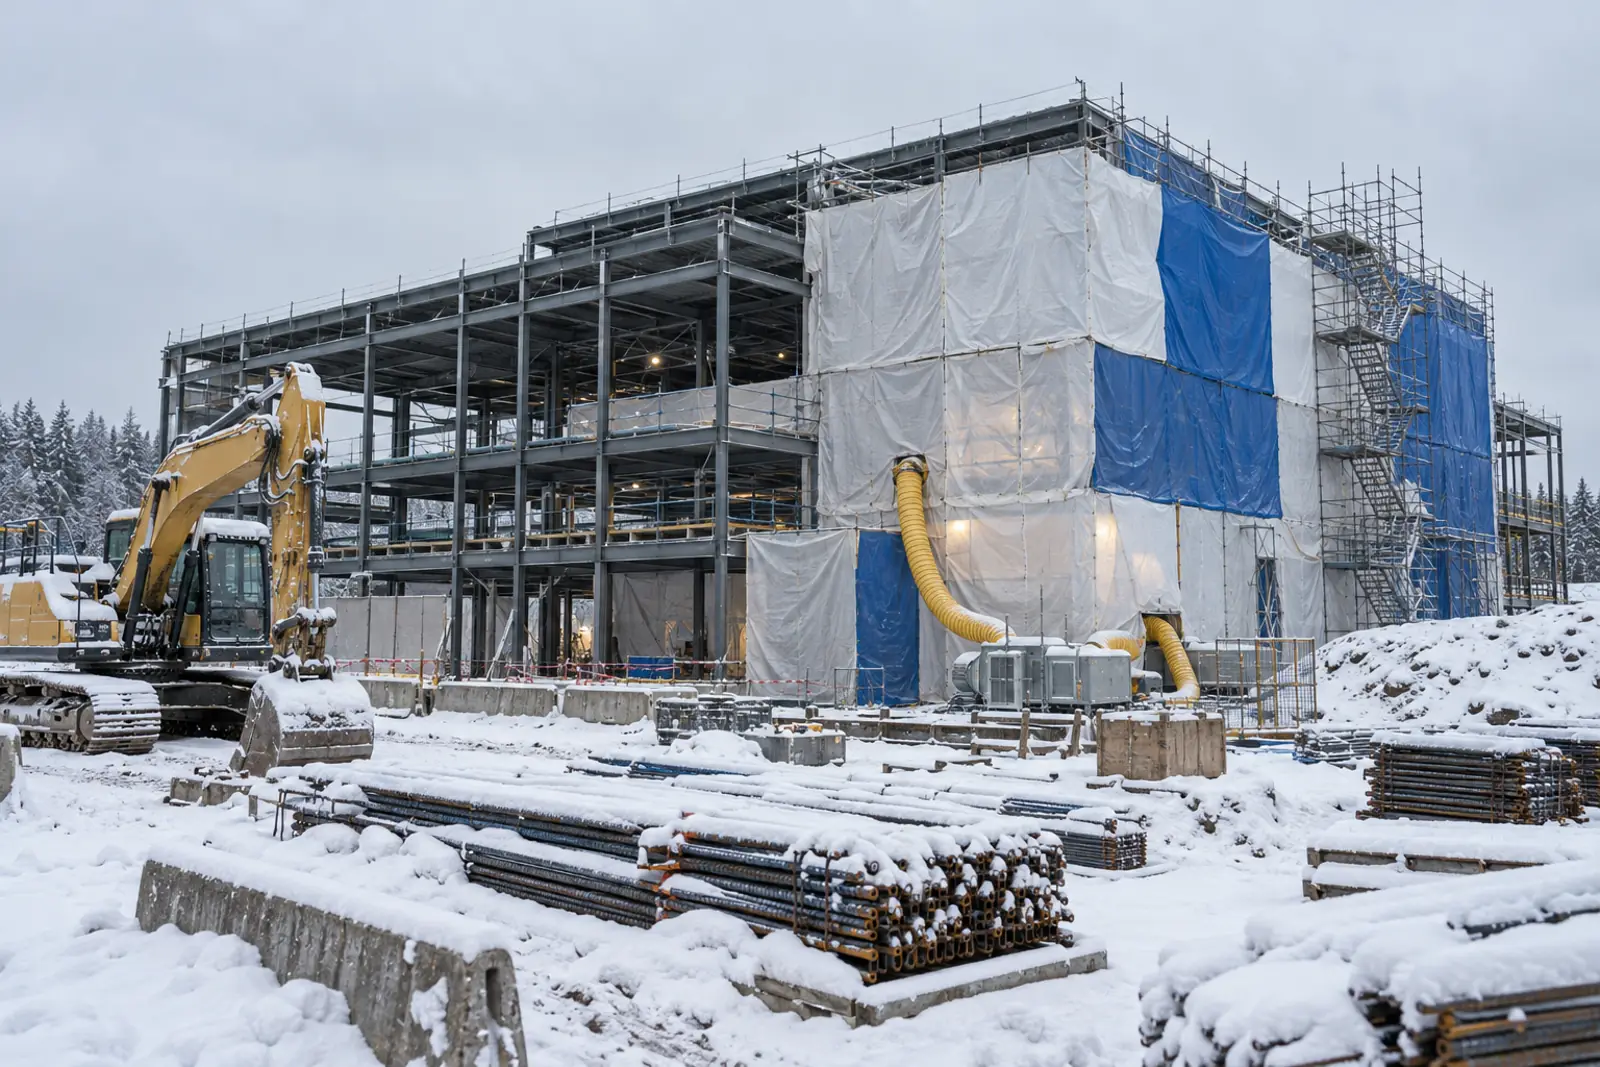
Best Time of Year to Build: Monthly Workload Index for US Commercial Construction and State Seasonal Swing Ranking
- Primary data
- Census Construction Spending (not seasonally adjusted); BLS CES national and State and Area; BLS JOLTS, CPS, PPI; NOAA Climate at a Glance
- Data period
- 2014 to 2025 (spending); 2016 to 2025 (employment); 2026 preliminary context
- Latest release used
- 2026-10-02
- Next release
- 2026-10-20 (state payrolls); 2026-11-02 (construction spending)
- Geography
- United States, 50 states and the District of Columbia
- Sources
- 22 (20 Tier 1)
Federal data show no single best time of year to build, but they show when contractors are least busy. Private nonresidential spending bottoms in January (index 88.8, 2014 to 2025 excluding 2020) and peaks in October (106.3). Construction payrolls trough in January and peak in July. State swings run from 1.7% (Florida) to 39.7% (Alaska).
How the index is built
National spending seasonal index (private nonresidential)
Formulaindex_m = mean over years y of (value_m,y / sum of value_y x 12 x 100); y = 2014 to 2025 excluding 2020
Inputs: rows 1 (full monthly series in raw/privtime.xlsx) (fact sheet rows)
Result: January 88.8, February 89.6, October 106.3; amplitude 19.7%
Work put in place is lowest in January and highest from August to October.
Limitations: Trend inflates late months; moving-average check gives 12.9%.
National employment seasonal index (construction)
Formulaindex_m = mean over years of (level_m,y / centered 2x12 moving average), rescaled to average 100; y = 2016 to 2025 excluding 2020
Inputs: rows 27, 50 (fact sheet rows)
Result: January 95.2, July 103.0; amplitude 8.2% (calendar-year method 9.9%)
Payrolls rise from February to July and ease from November.
Limitations: Counts jobs, not hours or output; mid-month reference period.
State seasonal amplitude ranking
Formulaamplitude = (max monthly index / min monthly index - 1) x 100; monthly index = level / centered 2x12 moving average, statewide construction employment, 2016 to 2025 excluding 2020
Inputs: rows 51, 52 (fact sheet rows)
Result: Alaska 39.7% (rank 1) to Florida 1.7% (rank 51); median 10.1%
Cold-winter states swing far more than Sun Belt states.
Limitations: DE, DC and HI use mining, logging and construction; all construction sectors, not commercial only.
Peak and trough month by state
Formulamonth with the highest and lowest average index per state
Inputs: rows 51, 52 (fact sheet rows)
Result: Trough January in 27 states, February in 24; peak July in 28, August in 8, June in 7, October in 5
The winter trough is universal; the peak month is only meaningful where the swing is large.
Limitations: Months with near-equal index values can swap with small data revisions.
Sensitivity: 2014 to 2019 vs 2021 to 2025
Formulasame indexes computed on each window; Spearman rank correlation of state amplitudes
Inputs: rows 1, 27, 51 (fact sheet rows)
Result: Spending 21.5% to 17.6%; employment 10.0% to 7.1%; 48 of 51 states narrower; rho 0.98
Seasonality has flattened since 2020 but the ordering of states is unchanged.
Limitations: The post-2020 window has only five years.
Climate link
FormulaPearson r between January average temperature (1991 to 2020 mean) and state amplitude
Inputs: rows 75, 51 (fact sheet rows)
Result: r = -0.86; cold states 23.7% vs warm states 3.1%
Winter temperature accounts for most of the cross-state difference.
Limitations: Correlation, not causation; project mix also differs by state.
Price seasonality test
Formulamean month-over-month percent change by calendar month and half-year, PPI WPU801 and WPUIP2312001
Inputs: rows 57, 58, 59 (fact sheet rows)
Result: WPU801 0.4% vs 0.47% (first vs second half); inputs 0.93% vs -0.08%
No weather season in finished-building prices; a mild first-half tilt in input goods.
Limitations: Means are sensitive to 2021 to 2022; excluding those years the input gap narrows.
How the monthly workload index is built
The index measures how far each calendar month sits above or below an average month, using raw (not seasonally adjusted) federal data. 100 means a normal month.
Seasonal index (spending): For each full year, each month's private nonresidential spending put in place is divided by that year's total and multiplied by 12 x 100. The twelve monthly values are then averaged across years. A value of 100 equals one twelfth of the year.
Seasonal index (employment): Employment is a level, not a flow, so each month's payroll count is divided by that year's average monthly level and multiplied by 100, then averaged across years.
Seasonal amplitude: (peak month index / trough month index – 1) x 100. It reads as the percentage by which the busiest month exceeds the slowest month in a typical year.
Spending comes from the Census Bureau not seasonally adjusted private construction table (release of 2026-10-01, data through August 2026). Census describes the survey as measuring construction work done each month, with sampled projects reporting progress monthly (methodology). The primary window is 2014 to 2025 excluding 2020; 2020 is tested separately because its pattern broke from every other year (lowest month December, highest June).
Employment comes from BLS flat files: national construction payrolls (CEU2000000001), nonresidential building (CEU2023620001) and nonresidential specialty trades (CEU2023800201), and statewide construction payrolls from the State and Area program. The employment window is the latest ten complete years, 2016 to 2025, with 2020 excluded.
Best time of year to build: what the national monthly index shows
Private nonresidential work put in place climbs from a January low (88.8) through spring, stays above average from May through December, and peaks in October (106.3). Payrolls follow the same arc with a smaller swing.
100 = average month; private nonresidential spending 2014 to 2025 and construction employment 2016 to 2025, both excluding 2020
Source: CB&C analysis of U.S. Census Bureau Construction Spending (October 1, 2026 release) and BLS Current Employment Statistics, not seasonally adjusted
| Month | Spending index (share method) | Spending index per calendar day | Construction employment index | Nonresidential specialty trades employment index | Average weekly hours | Construction hires (thousands) | Construction unemployment rate (%) |
|---|---|---|---|---|---|---|---|
| January | 88.8 | 87.2 | 95.2 | 95.8 | 38.1 | 346 | 7.6 |
| February | 89.6 | 96.8 | 95.5 | 95.8 | 38.2 | 313 | 7.6 |
| March | 94.7 | 92.9 | 96.8 | 97.0 | 38.7 | 386 | 6.7 |
| April | 98.0 | 99.4 | 98.9 | 98.8 | 39.0 | 472 | 5.6 |
| May | 100.9 | 99.1 | 100.8 | 100.4 | 39.4 | 453 | 4.4 |
| June | 103.3 | 104.8 | 102.5 | 102.1 | 39.6 | 427 | 4.4 |
| July | 102.8 | 100.9 | 103.0 | 102.7 | 39.5 | 418 | 4.2 |
| August | 104.7 | 102.8 | 102.9 | 102.8 | 39.7 | 374 | 4.0 |
| September | 105.3 | 106.8 | 102.1 | 102.0 | 39.4 | 350 | 4.0 |
| October | 106.3 | 104.3 | 102.2 | 102.1 | 39.6 | 368 | 4.3 |
| November | 104.0 | 105.4 | 101.1 | 101.1 | 39.0 | 272 | 4.6 |
| December | 101.6 | 99.7 | 99.0 | 99.5 | 38.9 | 207 | 5.3 |
Index 100 = average month. Spending: Census C30, not seasonally adjusted, 2014 to 2025 excluding 2020. Employment indexes: BLS, not seasonally adjusted, ratio to a centered 12-month moving average, 2016 to 2025 excluding 2020. Hours, hires and unemployment: BLS, not seasonally adjusted, means of 2016 to 2025 excluding 2020 (unemployment excludes October 2025, not collected).
Source: [1][5][6][11][15] U.S. Census Bureau; U.S. Bureau of Labor Statistics; U.S. Bureau of Labor Statistics; U.S. Bureau of Labor Statistics; U.S. Bureau of Labor Statistics
Across 2014 to 2025 excluding 2020, January's spending index is 88.8 and February's 89.6. March (94.7) and April (98.0) are still below average. The index crosses 100 in May (100.9) and stays above it through December (101.6).
The first quarter averages 91.0, the second 100.7, the third 104.3 and the fourth 104.0. On this measure, the last three months of the year carry the heaviest dollar volume of private nonresidential work in place.
Construction employment peaks earlier than spending. Payrolls reach index 103.0 in July and 102.9 in August, while spending is highest in October. Average weekly hours follow employment: 38.1 hours in January against 39.7 in August, 2016 to 2025 excluding 2020.
For an owner reading this as workload data: the January and February trough means fewer workers on payrolls, shorter weeks and less work in place. The summer and early autumn plateau means more crews already committed. Bid and start timing still depend on project-specific factors that these national data do not capture; see how to compare construction bids for bid-side checks.
State ranking: how strong the seasonal swing is in each state
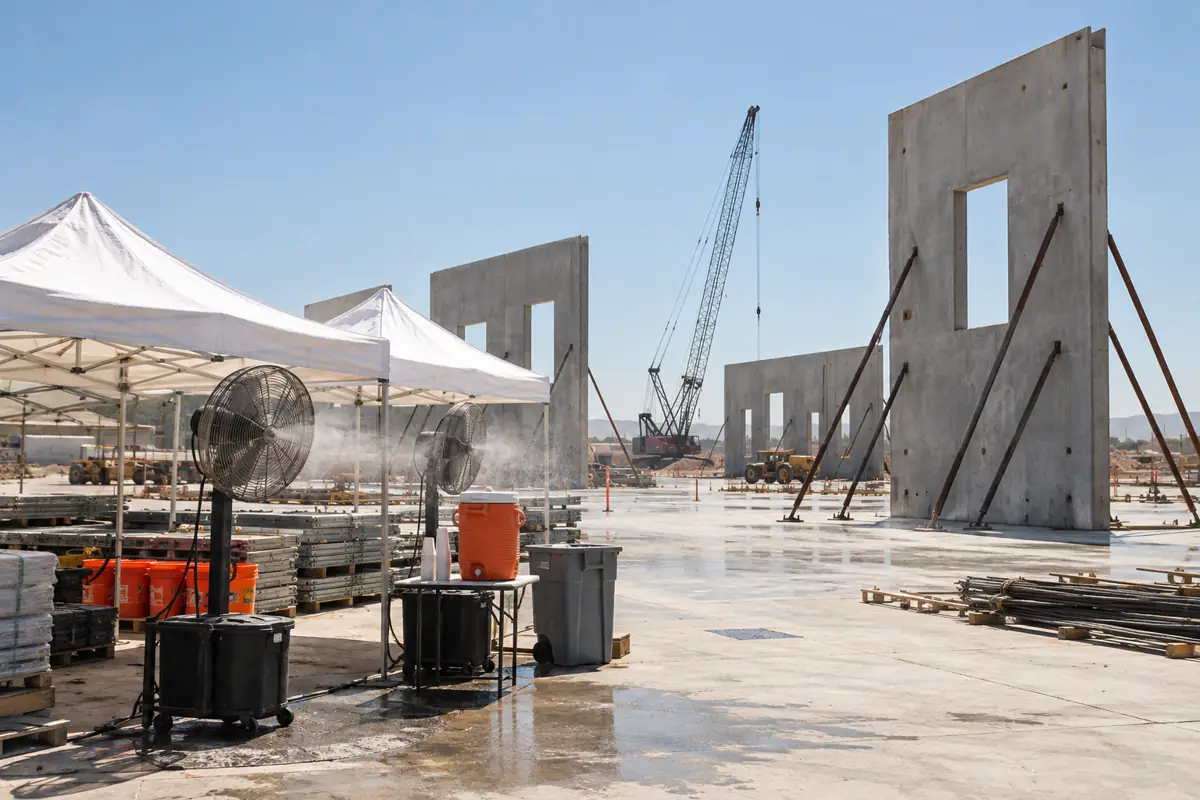
The seasonal swing in construction employment ranges from 39.7% in Alaska to 1.7% in Florida. Cold-winter states sit at the top of the ranking and the Sun Belt at the bottom.
Peak month index divided by trough month index, minus 1, percent; moving-average method, 2016 to 2025 excluding 2020
Source: CB&C analysis of BLS State and Area Current Employment Statistics, not seasonally adjusted (August 2026 file)
Top 10 and bottom 10 states by seasonal amplitude, percent, 2016 to 2025 excluding 2020
Source: CB&C analysis of BLS State and Area CES, not seasonally adjusted. DE, DC and HI use mining, logging and construction
Show all 51 rows
| Rank | State | Seasonal amplitude (%) | Peak month | Trough month | January avg. temp. (F, 1991 to 2020) | 2025 peak minus trough (thousand jobs) | Calendar-year method amplitude (%) | Series |
|---|---|---|---|---|---|---|---|---|
| 1 | Alaska | 39.7 | August | January | 4.2 | 4.5 | 40.9 | Construction |
| 2 | North Dakota | 37.8 | July | February | 10.5 | 9.0 | 38.1 | Construction |
| 3 | Minnesota | 31.7 | July | February | 10.1 | 37.9 | 33.3 | Construction |
| 4 | South Dakota | 27.7 | July | February | 18.4 | 6.0 | 29.2 | Construction |
| 5 | Iowa | 26.1 | July | February | 19.5 | 17.5 | 26.6 | Construction |
| 6 | Vermont | 23.0 | July | February | 17.4 | 2.7 | 23.4 | Construction |
| 7 | Montana | 22.9 | July | February | 21.1 | 7.9 | 24.6 | Construction |
| 8 | West Virginia | 22.0 | September | February | 31.4 | 8.2 | 23.7 | Construction |
| 9 | Wyoming | 21.8 | August | February | 21.8 | 3.5 | 22.8 | Construction |
| 10 | Illinois | 20.4 | July | February | 26.7 | 44.7 | 21.2 | Construction |
| 11 | Wisconsin | 19.9 | July | February | 15.3 | 24.3 | 21.5 | Construction |
| 12 | Michigan | 19.1 | July | February | 20.2 | 34.1 | 21.0 | Construction |
| 13 | Connecticut | 15.9 | July | February | 27.2 | 8.8 | 16.5 | Construction |
| 14 | Rhode Island | 15.9 | August | February | 29.1 | 2.9 | 17.7 | Construction |
| 15 | Ohio | 15.7 | July | February | 28.1 | 35.1 | 17.2 | Construction |
| 16 | Nebraska | 15.2 | July | February | 25.1 | 9.0 | 16.6 | Construction |
| 17 | Maine | 15.1 | July | February | 15.2 | 3.4 | 16.4 | Construction |
| 18 | Pennsylvania | 14.5 | July | February | 26.6 | 33.1 | 15.2 | Construction |
| 19 | Massachusetts | 13.5 | July | February | 26.0 | 17.0 | 14.4 | Construction |
| 20 | Idaho | 12.8 | July | January | 25.1 | 8.3 | 17.1 | Construction |
| 21 | Indiana | 12.2 | July | February | 27.7 | 21.6 | 14.1 | Construction |
| 22 | New Hampshire | 11.9 | July | February | 19.1 | 3.1 | 13.2 | Construction |
| 23 | New York | 11.8 | August | February | 21.6 | 33.6 | 12.5 | Construction |
| 24 | Kansas | 10.5 | July | January | 31.1 | 9.0 | 11.6 | Construction |
| 25 | New Jersey | 10.2 | August | February | 31.7 | 15.8 | 11.0 | Construction |
| 26 | Missouri | 10.1 | July | February | 30.9 | 19.3 | 11.5 | Construction |
| 27 | Kentucky | 9.7 | July | February | 34.4 | 9.8 | 11.1 | Construction |
| 28 | Oregon | 8.8 | August | January | 33.5 | 7.8 | 10.8 | Construction |
| 29 | Washington | 7.8 | August | January | 31.9 | 14.1 | 9.3 | Construction |
| 30 | Utah | 7.3 | July | January | 28.0 | 7.7 | 10.3 | Construction |
| 31 | Colorado | 7.2 | July | January | 26.3 | 8.2 | 8.6 | Construction |
| 32 | Delaware | 6.2 | July | January | 35.2 | 1.8 | 7.1 | Mining, logging and construction |
| 33 | California | 5.9 | August | January | 44.9 | 36.8 | 7.3 | Construction |
| 34 | Arkansas | 5.3 | June | January | 40.2 | 2.3 | 7.0 | Construction |
| 35 | Maryland | 5.2 | July | January | 33.9 | 10.6 | 5.8 | Construction |
| 36 | Nevada | 5.2 | October | January | 32.8 | 7.7 | 9.4 | Construction |
| 37 | Tennessee | 4.9 | June | January | 37.9 | 8.0 | 7.4 | Construction |
| 38 | Virginia | 4.9 | July | January | 35.8 | 17.2 | 6.1 | Construction |
| 39 | Louisiana | 4.6 | October | January | 49.9 | 6.8 | 5.4 | Construction |
| 40 | District of Columbia | 4.2 | June | January | n/a | 0.8 | 3.6 | Mining, logging and construction |
| 41 | New Mexico | 4.2 | July | January | 35.7 | 3.5 | 6.0 | Construction |
| 42 | Oklahoma | 4.1 | September | January | 38.3 | 5.3 | 5.9 | Construction |
| 43 | Mississippi | 3.8 | October | January | 45.6 | 3.4 | 5.3 | Construction |
| 44 | Hawaii | 3.1 | July | January | n/a | 1.6 | 3.6 | Mining, logging and construction |
| 45 | Alabama | 3.0 | October | January | 45.3 | 5.2 | 5.6 | Construction |
| 46 | North Carolina | 3.0 | June | January | 40.8 | 13.1 | 5.7 | Construction |
| 47 | South Carolina | 2.9 | June | January | 45.3 | 6.3 | 4.6 | Construction |
| 48 | Texas | 2.9 | October | January | 47.1 | 42.8 | 6.0 | Construction |
| 49 | Georgia | 2.8 | June | January | 46.7 | 10.8 | 5.6 | Construction |
| 50 | Arizona | 2.3 | June | January | 43.2 | 4.6 | 6.8 | Construction |
| 51 | Florida | 1.7 | November | January | 58.3 | 10.2 | 5.3 | Construction |
Amplitude = (peak month index / trough month index – 1) x 100. Monthly index = level divided by a centered 2×12 moving average, averaged over 2016 to 2025 excluding 2020 and rescaled to average 100. The calendar-year column divides by each year's mean instead and keeps within-year growth. BLS State and Area CES, not seasonally adjusted, August 2026 file. Temperatures: NOAA NCEI Climate at a Glance (no statewide series for HI, DC).
Source: [7][8][18] U.S. Bureau of Labor Statistics; U.S. Bureau of Labor Statistics; NOAA National Centers for Environmental Information
All ten widest swings are in states with a January average at or below 31.4 F: Alaska, North Dakota, Minnesota, South Dakota (27.7%), Iowa (26.1%), Vermont (23.0%), Montana (22.9%), West Virginia (22.0%), Wyoming (21.8%) and Illinois (20.4%).
The largest construction markets sit lower in the ranking. Texas swings 2.9%, California 5.9%, Florida 1.7% and New York 11.8%. In job terms, Illinois added 44.7 thousand construction jobs between its 2025 low and high, Texas 42.8 thousand and Minnesota 37.9 thousand.
Peak and trough month by state
Every state's construction payroll bottoms in January or February. Most peak in July; in warm states the curve is so flat that the peak month carries little meaning.
Of 51 states and DC, 27 have their lowest month in January and 24 in February. February troughs are concentrated in the Northern Plains, Upper Midwest and Northeast, where winter work stays depressed for longer.
Peaks fall in July in 28 states, August in 8, June in 7, October in 5, September in 2 and November in 1. The June and October peaks belong to Southern states such as Georgia, South Carolina and Arizona (June) and Texas, Louisiana and Alabama (October).
In those states the gap between the peak and the neighbouring months is small. Florida's index runs from 98.7 in January to 100.5 in November, and Texas's from 97.9 in January to 100.8 in October. A Minnesota contractor, by contrast, carries 111.5 in July against 84.7 in February.
Winter temperature explains most of the state differences
A state's January average temperature predicts its seasonal swing closely (r = -0.86).
Using NOAA Climate at a Glance statewide January temperatures averaged over 1991 to 2020, the Pearson correlation with state seasonal amplitude is -0.86 and the rank correlation -0.9 across 49 states (no statewide series exists for Hawaii or DC).
The 13 states with a January average below 25 F average a 23.7% swing. The 7 states at 45 F or warmer average 3.1%. Alaska (4.2 F) has the widest swing; Florida (58.3 F) is the warmest and ranks near the bottom.
Temperature does not explain every case. West Virginia (31.4 F) swings 22.0%, more than colder Maine (15.1% at 15.2 F). These data do not show what drives such exceptions.
Sensitivity test: windows, 2020 and method
January stays the low month and October the spending high in every window and method tested. The size of the swing depends on the method and has narrowed since 2020.
Private nonresidential spending index by month, two windows, with construction employment for comparison
Source: CB&C analysis of U.S. Census Bureau Construction Spending and BLS CES, not seasonally adjusted
| Measure | Window | Amplitude (%) | Trough month | Peak month |
|---|---|---|---|---|
| Private nonresidential spending, share method | 2014 to 2025 excl. 2020 | 19.7 | January | October |
| Private nonresidential spending, share method | 2014 to 2025 incl. 2020 | 18.2 | January | October |
| Private nonresidential spending, share method | 2014 to 2019 | 21.5 | January | October |
| Private nonresidential spending, share method | 2021 to 2025 | 17.6 | January | October |
| Private nonresidential spending, per calendar day | 2014 to 2025 excl. 2020 | 22.5 | January | September |
| Private nonresidential spending, ratio to moving average | 2014 to 2025 excl. 2020 | 12.9 | January | October |
| Private nonresidential spending, Census implied factor | 2023 to 2025 | 10.4 | January | October |
| Private residential spending, share method (comparison) | 2014 to 2025 excl. 2020 | 40.3 | January | July |
| Construction employment | 2016 to 2025 excl. 2020 | 8.2 | January | July |
| Construction employment | 2016 to 2025 incl. 2020 | 7.7 | January | August |
| Construction employment | 2014 to 2019 | 10.0 | January | July |
| Construction employment | 2021 to 2025 | 7.1 | January | July |
| Construction employment | 2016 to 2025 excl. 2020, calendar-year method | 9.9 | January | August |
| Nonresidential specialty trades employment | 2016 to 2025 excl. 2020 | 7.3 | January | August |
| Nonresidential specialty trades employment | 2016 to 2025 incl. 2020 | 7.0 | January | August |
| Nonresidential specialty trades employment | 2014 to 2019 | 8.9 | January | August |
| Nonresidential specialty trades employment | 2021 to 2025 | 6.7 | January | August |
| Nonresidential specialty trades employment | 2016 to 2025 excl. 2020, calendar-year method | 9.0 | January | August |
| Nonresidential building employment | 2016 to 2025 excl. 2020 | 5.5 | January | July |
| Nonresidential building employment | 2016 to 2025 incl. 2020 | 4.9 | January | July |
| Nonresidential building employment | 2014 to 2019 | 6.4 | February | July |
| Nonresidential building employment | 2021 to 2025 | 4.9 | February | July |
| Nonresidential building employment | 2016 to 2025 excl. 2020, calendar-year method | 7.2 | January | July |
Amplitude = (peak index / trough index – 1) x 100. Employment rows use the moving-average method unless marked calendar-year. Census implied factor = not seasonally adjusted value divided by one twelfth of the seasonally adjusted annual rate; it includes trading-day effects.
Source: [1][2][5] U.S. Census Bureau; U.S. Census Bureau; U.S. Bureau of Labor Statistics
Window: the spending swing was 21.5% in 2014 to 2019 and 17.6% in 2021 to 2025. The employment swing fell from 10.0% to 7.1%. Including 2020 changes the spending swing to 18.2% and the employment swing to 7.7%. The calendar-year employment method, which keeps within-year growth, gives 9.9%.
Method: the share-of-year method mixes trend into the seasonal pattern. Private nonresidential spending grew 116.7% from 2014 to 2025, so in a growing year the later months look larger. A ratio to a centered 12-month moving average removes most of that trend and gives a 12.9% swing. Census's implied factors for 2023 to 2025 give 10.4%. The share-method 19.7% should be read as an upper bound.
States: 48 of 51 swings narrowed between the two windows, and the median fell from 11.9% to 9.3%. Rankings barely moved (rank correlation 0.98), so the states that were most seasonal before 2020 still are.
| Year | Lowest month | Highest month | Single-year amplitude (%) |
|---|---|---|---|
| 2014 | January | October | 24.9 |
| 2015 | January | June | 29.8 |
| 2016 | January | September | 29.2 |
| 2017 | February | June | 12.7 |
| 2018 | January | August | 12.8 |
| 2019 | January | October | 28.7 |
| 2020 | December | June | 8.0 |
| 2021 | February | October | 16.5 |
| 2022 | January | November | 32.3 |
| 2023 | January | October | 24.6 |
| 2024 | January | August | 11.9 |
| 2025 | December | August | 8.6 |
Census C30, not seasonally adjusted. 2020 shown for reference but excluded from the primary index.
Source: [1] U.S. Census Bureau
Single years vary. January was the lowest spending month in 8 of 12 years. In 2025 the spending curve was unusually flat (swing 8.6%), with December the low month, while 2022 had a 32.3% swing.
Components: building types, hiring and labor slack
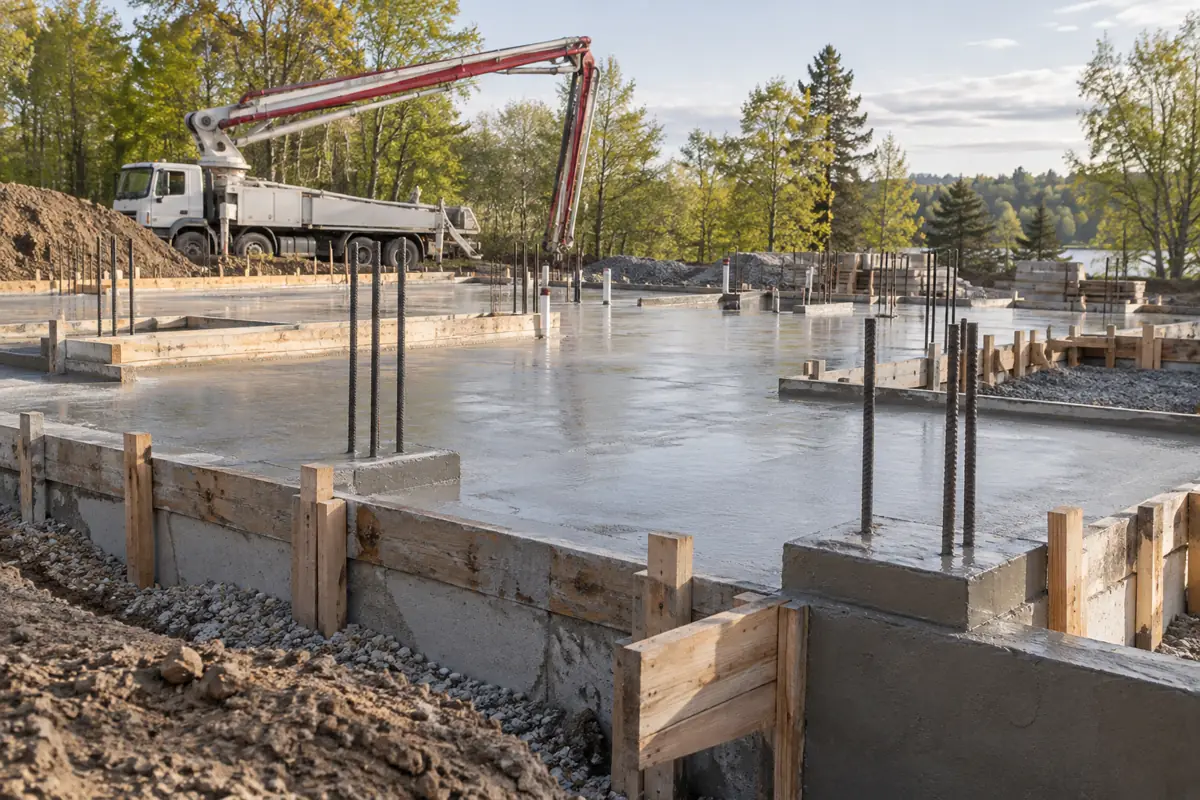
Every major private nonresidential building type bottoms in January or February, but the swing ranges from 9.0% for power projects to over 30% for communication, transportation and educational work. Hiring and worker availability move ahead of work in place.
| Type of construction | Amplitude (%) | Trough month | Peak month | 2025 spending, NSA ($ millions) |
|---|---|---|---|---|
| Communication | 32.5 | January | December | 27,498 |
| Transportation | 32.3 | February | November | 20,350 |
| Educational | 30.8 | January | June | 26,076 |
| Religious | 27.8 | February | September | 5,561 |
| Commercial (incl. farm) | 27.7 | January | October | 122,480 |
| Amusement and Recreation | 26.6 | January | October | 22,225 |
| Manufacturing | 23.1 | January | October | 213,820 |
| Office | 22.6 | January | September | 104,269 |
| Health care | 17.3 | January | October | 59,333 |
| Lodging | 15.9 | January | October | 25,387 |
| Power (incl. gas and oil) | 9.0 | January | October | 152,022 |
Share method, 2014 to 2025 excluding 2020. Census C30 privtime.xlsx, October 1, 2026 release.
Source: [1] U.S. Census Bureau
Educational construction is the one category that peaks in June (30.8% swing), matching the school summer break. Manufacturing, the largest category at $213,820 million in 2025, swings 23.1% and peaks in October. Power, the second largest, has the smallest swing at 9.0%.
Mean of 2016 to 2025 excluding 2020, not seasonally adjusted, percent; all industries for comparison
Source: CB&C analysis of BLS Current Population Survey series LNU04032231 and LNU04000000 (October 2025 not collected)
Labor indicators lead work in place. Construction hires (JOLTS, not seasonally adjusted) average 472 thousand in April and 207 thousand in December, 2.3 times as many. The unemployment rate of experienced construction workers averages 7.6% in January and February against 4.0% in August and September. AGC noted in February 2026 that construction unemployment normally rises in winter months (AGC). For the structural side of labor supply, see the construction labor shortage tracker.
Do construction prices change by season?
Not in a warm-versus-cold pattern for finished buildings. Material input prices have tended to rise more in the first half of the year.
| Series | Jan, Apr, Jul, Oct (%) | Other months (%) | Jan to Jun (%) | Jul to Dec (%) | Jan to Jun, excl. 2021 to 2022 (%) | Jul to Dec, excl. 2021 to 2022 (%) |
|---|---|---|---|---|---|---|
| New nonresidential building construction (WPU801) | 1.13 | 0.09 | 0.40 | 0.47 | 0.23 | 0.18 |
| Inputs to nonresidential construction, goods (WPUIP2312001) | 0.56 | 0.36 | 0.93 | -0.08 | 0.44 | -0.04 |
Mean of month-over-month percent changes in not seasonally adjusted indexes. BLS PPI flat files, August 2026 data.
Source: [12][13] U.S. Bureau of Labor Statistics; U.S. Bureau of Labor Statistics
The PPI for new nonresidential building construction (WPU801) changes mostly in the first month of each quarter: a mean of 1.13% in January, April, July and October against 0.09% in the other months, 2016 to 2025 excluding 2020. That is a calendar step, not a weather effect: January to June averages 0.4% a month and July to December 0.47%. The BLS series catalog carries no seasonally adjusted version of WPU801 (wp.series).
Input goods (WPUIP2312001) rose a mean 0.93% a month from January to June and -0.08% from July to December. Excluding the 2021 to 2022 price surge, the gap shrinks to 0.44% against -0.04%. The tendency is real but small next to year-to-year price moves. Price levels and trends are covered in the commercial construction price index.
What the index cannot tell you
The index describes a typical year at national and state level. It does not measure local backlog, bid prices or availability of a specific contractor.
- The Census monthly spending table used here is national; it has no state detail.
- State figures cover all construction (residential, nonresidential and civil), not commercial building alone.
- Employment refers to the pay period including the 12th of each month (BLS); it does not measure crew idle time or backlog.
- The share method overstates the swing in growing years; the moving-average and Census factor checks give smaller values.
- Recent months (2026) are preliminary and are excluded from the averages, except as inputs to the moving average at the end of 2025.
- This report describes data patterns and is not legal, financial or project-planning advice.
Key findings
- January is the low month for US private nonresidential construction spending put in place, at 11.2 index points below an average month (index 88.8), 2014 to 2025 excluding 2020.[1]
- October is the high month for US private nonresidential spending (index 106.3), with August to October all above 104.7, 2014 to 2025 excluding 2020.[1]
- The fourth quarter averages an index of 104.0 and the first quarter 91.0 for US private nonresidential spending, 2014 to 2025 excluding 2020.[1]
- Measured per calendar day, February's US spending index rises by 7.2 points to 96.8, so part of the February dip is the short month, 2014 to 2025 excluding 2020.[1]
- Census's own seasonal factors for US private nonresidential spending, 2023 to 2025, put January at 93.9 and October at 103.7, a 10.4% swing, smaller than the share-method 19.7%.[1][2]
- US construction employment (not seasonally adjusted) averages index 95.2 in January and 103.0 in July, a 8.2% swing, 2016 to 2025 excluding 2020.[5]
- US nonresidential specialty trade employment swings 7.3% and nonresidential building employment 5.5% between January and the summer peak, 2016 to 2025 excluding 2020.[5]
- In 2025, US construction payrolls (not seasonally adjusted) rose from 7,938 thousand in January to 8,476 thousand in July, a gain of 538,000 jobs (6.8%).[5]
- Alaska (39.7%), North Dakota (37.8%) and Minnesota (31.7%) have the widest seasonal swings in state construction employment, 2016 to 2025 excluding 2020.[7]
- Florida (1.7%), Arizona (2.3%) and Georgia (2.8%) have the narrowest seasonal swings in state construction employment, 2016 to 2025 excluding 2020.[7]
- Construction employment troughs in January in 27 of 51 states and in February in 24; it peaks in July in 28, in August in 8 and in June in 7, 2016 to 2025 excluding 2020.[7][8]
- States with a January average below 25 F (1991 to 2020) average a 23.7% seasonal swing, 7.6 times the 3.1% average of states at 45 F or warmer.[7][18]
- The median state swing fell from 11.9% in 2014 to 2019 to 9.3% in 2021 to 2025, while state rankings stayed stable (rank correlation 0.98).[7]
- US construction hires (not seasonally adjusted) average 472 thousand in April and 207 thousand in December, 2016 to 2025 excluding 2020.[11]
- The unemployment rate of experienced US construction workers averages 7.6% in January and 4.0% in August, 2016 to 2025 excluding 2020 (not seasonally adjusted).[15]
Summary for decision makers
- US private nonresidential construction spending put in place is lowest in January (index 88.8) and highest in October (index 106.3), using Census not seasonally adjusted data for 2014 to 2025 excluding 2020.
- January was the lowest spending month in 8 of the 12 years from 2014 to 2025; the high point moved between June and November, so the busy season is a plateau rather than a single month.
- US construction employment (not seasonally adjusted) troughs in January (index 95.2) and peaks in July (index 103.0), a swing of 8.2% over 2016 to 2025 excluding 2020; in 2025 the swing was 538,000 jobs.
- State swings range from 39.7% in Alaska and 37.8% in North Dakota to 2.3% in Arizona and 1.7% in Florida; the median state swing is 10.1%.
- Winter temperature tracks the state gap closely: the correlation between January average temperature and seasonal swing is -0.86 across 49 states, and the coldest 13 states average a 23.7% swing against 3.1% for the 7 warmest.
- Seasonality has narrowed since 2020: 48 of 51 state swings were smaller in 2021 to 2025 than in 2014 to 2019, and the national employment swing fell from 10.0% to 7.1%.
- The output price index for new nonresidential buildings shows steps in January, April, July and October (mean change 1.13% vs 0.09% in other months) but no warm or cold season pattern (0.4% in January to June vs 0.47% in July to December).
Questions people ask
What is the best time of year to start a commercial construction project?
The data cannot pick a start date, but they show contractor workload by month. US private nonresidential work in place is lowest in January (index 88.8) and February (89.6), and construction payrolls are lowest in January (index 95.2). Work in place is heaviest from August to October. Hiring peaks in April (472 thousand hires on average), so spring is when firms add crews for the busy season (2016 to 2025 excluding 2020).
What is the slowest month for construction?
January. It is the lowest month for US private nonresidential spending put in place (index 88.8, 2014 to 2025 excluding 2020) and for construction employment (index 95.2, 2016 to 2025 excluding 2020). January was the lowest spending month in 8 of 12 years, and the lowest employment month in 27 of 51 states; the other 24 bottom out in February.
Is construction seasonal in Florida?
Barely. Florida has the smallest seasonal swing in construction employment of any state: 1.7% between its January low and November high (2016 to 2025 excluding 2020), ranking 51st of 51. The swing narrowed from 2.4% in 2014 to 2019 to 1.5% in 2021 to 2025. Florida's January average temperature of 58.3 F (1991 to 2020) is the warmest of the 49 states with NOAA statewide data. A simpler calendar-year method gives 5.3%, most of which is job growth during the year rather than seasonality.
Do construction prices change by season?
Not in a weather pattern. The BLS PPI for new nonresidential building construction rose a mean 0.4% a month in January to June and 0.47% in July to December (2016 to 2025 excluding 2020); its changes cluster in January, April, July and October. Material input goods rose more in the first half (0.93% vs -0.08%), a gap that shrinks to 0.44% vs -0.04% without 2021 to 2022.
When do contractors have the most availability?
No federal series measures contractor availability directly. Indirect signs point to January and February: construction payrolls are at their lowest (index 95.2), average weekly hours are shortest (38.1), and the unemployment rate of experienced construction workers averages 7.6% against 4.0% in August (2016 to 2025 excluding 2020). Local backlog can differ from these national averages.
For journalists and researchers
If you cite only a few, cite these
- January is the slowest month for US commercial construction: spending index 88.8, employment index 95.2.[1][5]
- US construction employment swings 8.2% between January and July.[5]
- State seasonal swings range from 39.7% (Alaska) to 1.7% (Florida), and track January temperature (r = -0.86).[7][18]
Most quotable statistics
- US private nonresidential construction work put in place runs 11.2% below an average month in January and peaks in October (Census, 2014 to 2025 excluding 2020).[1]
- US construction payrolls swing 8.2% from the January low to the July high (BLS, 2016 to 2025 excluding 2020).[5]
- Alaska's construction workforce swings 39.7% through the year; Florida's swings 1.7% (BLS, 2016 to 2025 excluding 2020).[7]
- States with January averages below 25 F have a 23.7% seasonal construction swing, against 3.1% in states at 45 F or warmer.[7][18]
- Construction is less seasonal than before 2020: 48 of 51 state swings narrowed between 2014 to 2019 and 2021 to 2025.[7]
- Construction hires in April average 2.3 times December's level (JOLTS, 2016 to 2025 excluding 2020).[11]
Press summary
A new analysis of Census and Bureau of Labor Statistics data by Commercial Builders & Contractors measures when US commercial construction is busiest and slowest. Private nonresidential work put in place bottoms in January, at an index of 88.8 against an average month of 100, and peaks in October at 106.3 (2014 to 2025, excluding 2020). Construction payrolls swing 8.2% from January to July. State swings range from 39.7% in Alaska to 1.7% in Florida and follow winter temperature closely (r = -0.86). Construction payrolls in every state and the District of Columbia bottom out in January or February. Seasonality has narrowed since 2020, with 48 of 51 state swings smaller in 2021 to 2025. Hiring peaks in April, and unemployment among experienced construction workers averages 7.6% in January against 4.0% in August. Finished-building prices show no weather season. The data, formulas and state table are free to reuse under CC BY 4.0.
Suggested headlines
- January is the slowest month for US commercial construction, federal data show
- Construction payrolls swing 8.2% between winter and summer
- Alaska and North Dakota have the most seasonal construction workforces; Florida and Arizona the least
- Cold winters explain most of the state gap in construction seasonality
- US construction has become less seasonal since 2020
How to cite this report
Commercial Builders & Contractors. (2026). Best Time of Year to Build: Monthly Workload Index for US Commercial Construction and State Seasonal Swing Ranking. Retrieved from https://commercialbuildersandcontractors.com/construction-seasonality/
Reuse license
Data and tables are licensed CC BY 4.0. Attribution: “Source: Commercial Builders & Contractors, Best Time of Year to Build: Monthly Workload Index for US Commercial Construction and State Seasonal Swing Ranking” with a link to this page.
Download the data
Every table in this report is available as a CSV under CC BY 4.0. The fact sheet lists each value with its source URL and access date.
- derived_metrics.csv (CSV)
- fact_sheet.csv (CSV)
- National monthly workload index, US private nonresidential construction (CSV)
- State seasonal amplitude ranking: construction employment, peak month vs trough month (CSV)
- Sensitivity test: seasonal amplitude by method and time window (CSV)
- Seasonal amplitude by private nonresidential building type (CSV)
- Do construction prices move by season? Mean monthly change in two PPIs, 2016 to 2025 excluding 2020 (CSV)
- Year-by-year check: lowest and highest spending month, private nonresidential, 2014 to 2025 (CSV)
Frequently asked questions
Which month has the most commercial construction activity in the US?
October, for private nonresidential spending put in place (index 106.3, 2014 to 2025 excluding 2020). Employment peaks earlier, in July (index 103.0, 2016 to 2025 excluding 2020).
How much lower is construction spending in January?
January's US private nonresidential spending index is 88.8, which is 11.2 points below an average month (Census, 2014 to 2025 excluding 2020).
How big is the seasonal swing in US construction employment?
8.2% between the January low and July high, 2016 to 2025 excluding 2020. In 2025, payrolls rose 538,000 from January to July (BLS, not seasonally adjusted).
Which states have the most seasonal construction workforce?
Alaska (39.7%), North Dakota (37.8%), Minnesota (31.7%), South Dakota (27.7%) and Iowa (26.1%), 2016 to 2025 excluding 2020 (BLS State and Area).
Which states have the least seasonal construction workforce?
Florida (1.7%), Arizona (2.3%), Georgia (2.8%), and Texas and South Carolina (2.9% each), 2016 to 2025 excluding 2020 (BLS State and Area).
Does cold weather explain why some states are more seasonal?
Largely. The correlation between January average temperature (NOAA, 1991 to 2020) and seasonal swing is -0.86 across 49 states. States below 25 F average 23.7% against 3.1% for states at 45 F or warmer.
Has construction become less seasonal?
Yes. The US employment swing fell from 10.0% in 2014 to 2019 to 7.1% in 2021 to 2025, and 48 of 51 state swings narrowed. The spending swing fell from 21.5% to 17.6%.
Why does February look slow in construction spending data?
Partly because it is short. Measured per calendar day, February's US spending index rises by 7.2 points to 96.8 (2014 to 2025 excluding 2020), while January stays the low month at 87.2.
When do construction firms hire the most workers?
April. US construction hires average 472 thousand in April and 207 thousand in December, 2.3 times as many (JOLTS, not seasonally adjusted, 2016 to 2025 excluding 2020).
Why do news reports show different construction employment numbers for the same month?
Most releases quote seasonally adjusted data. AGC reported 8,308,000 construction jobs for January 2026, seasonally adjusted; the not seasonally adjusted BLS count for the same month was about 305,000 lower, which is the winter dip that adjustment removes.
Methodology
Source selection: Tier 1 federal datasets only for every number in the index: Census Construction Spending (C30) not seasonally adjusted private series, BLS Current Employment Statistics national and State and Area flat files, BLS JOLTS and Current Population Survey series for construction, BLS PPI flat files, and NOAA NCEI Climate at a Glance statewide temperatures. Trade association material (AGC, ABC) is used only for headline context and is marked Tier 2.
Inclusion and exclusion: complete calendar years only. The spending index uses 2014 to 2025; the employment and state indexes use the latest ten complete years, 2016 to 2025. 2020 is excluded from primary results and tested separately. 2026 months are preliminary and are reported only as recent context. October 2025 Current Population Survey data were not collected because of the 2025 lapse in appropriations and are skipped.
Derived metrics: monthly spending index = mean of each month's share of the annual total x 12 x 100; employment index = mean of each month's level divided by a centered 2×12 moving average, rescaled to average 100 (a calendar-year version, level divided by the annual mean, is shown as a check); amplitude = (peak index / trough index – 1) x 100. Spending checks: a per-calendar-day index, a ratio to a centered 2×12 moving average, and the Census implied factor (not seasonally adjusted value / (seasonally adjusted annual rate / 12)). All calculations are in scripts/compute.py and derived_metrics.csv.
Conflicting numbers: the share method, moving-average method and Census factors give different swing sizes (from 10.4% to 22.5% for spending). The report states the share method as the brief's primary measure, labels it an upper bound, and shows the alternatives next to it. Seasonally adjusted figures quoted by trade groups are not mixed with unadjusted figures except to show the gap between them.
Limitations: monthly construction spending is not published by state, so the state ranking uses employment for all construction, not commercial building alone. Delaware, the District of Columbia and Hawaii use mining, logging and construction. Employment measures jobs in the pay period including the 12th, not hours worked or backlog. Climate correlation does not establish cause.
Last updated 2026-10-07 using the Census release of 2026-10-01 (data through August 2026), BLS national data through September 2026, BLS state data through August 2026, JOLTS through August 2026 and PPI through August 2026. Not advice: the report describes historical data patterns and does not recommend when any project should bid or start.
This report presents published data with its limitations. It is not legal, financial or investment advice.
Sources, ranked by quality
Tier 1: primary and official sources (20)
- [1] U.S. Census Bureau. Construction Spending: Value of Private Construction Put in Place, Not Seasonally Adjusted (privtime.xlsx), October 1, 2026 release. January 1993 to August 2026 (2014 to August 2026 used). Accessed 2026-10-07.
- [2] U.S. Census Bureau. Construction Spending: Value of Private Construction Put in Place, Seasonally Adjusted Annual Rate (privsatime.xlsx), October 1, 2026 release. January 1993 to August 2026. Accessed 2026-10-07.
- [3] U.S. Census Bureau. Construction Spending: Value Put in Place Methodology. current methodology. Accessed 2026-10-07.
- [4] U.S. Census Bureau. Construction Spending: Release Schedule. 2026 to 2027 release dates. Accessed 2026-10-07.
- [5] U.S. Bureau of Labor Statistics. Current Employment Statistics flat file ce.data.20a.Construction.Employment. through September 2026. Accessed 2026-10-07.
- [6] U.S. Bureau of Labor Statistics. Current Employment Statistics flat file ce.data.20b.Construction.AllEmployeeHoursAndEarnings. through September 2026. Accessed 2026-10-07.
- [7] U.S. Bureau of Labor Statistics. State and Area Employment flat file sm.data.62.Construction.Current. January 2007 to August 2026. Accessed 2026-10-07.
- [8] U.S. Bureau of Labor Statistics. State and Area Employment flat file sm.data.61.MiningLoggingConstr.Current. January 2007 to August 2026. Accessed 2026-10-07.
- [9] U.S. Bureau of Labor Statistics. CES State and Area: Seasonal Adjustment methodology. current methodology. Accessed 2026-10-07.
- [10] U.S. Bureau of Labor Statistics. JOLTS flat file jt.data.2.JobOpenings (series JTU230000000000000JOL). December 2000 to August 2026. Accessed 2026-10-07.
- [11] U.S. Bureau of Labor Statistics. JOLTS flat file jt.data.3.Hires (series JTU230000000000000HIL). December 2000 to August 2026. Accessed 2026-10-07.
- [12] U.S. Bureau of Labor Statistics. Producer Price Index flat file wp.data.80.Construction (series WPU801). June 2009 to August 2026. Accessed 2026-10-07.
- [13] U.S. Bureau of Labor Statistics. Producer Price Index flat file wp.data.80i.ConstructnInputs (series WPUIP2312001). June 2010 to August 2026. Accessed 2026-10-07.
- [14] U.S. Bureau of Labor Statistics. Seasonal Adjustment in the PPI. current methodology. Accessed 2026-10-07.
- [15] U.S. Bureau of Labor Statistics. Unemployment Rate, Construction Industry, Private Wage and Salary Workers, not seasonally adjusted (LNU04032231). January 2016 to December 2025 (October 2025 not collected). Accessed 2026-10-07.
- [16] U.S. Bureau of Labor Statistics. Schedule of Releases for the Employment Situation. 2026 schedule. Accessed 2026-10-07.
- [17] U.S. Bureau of Labor Statistics. Schedule of Releases for the State Employment and Unemployment (Monthly). 2026 schedule. Accessed 2026-10-07.
- [18] NOAA National Centers for Environmental Information. Climate at a Glance: Statewide Time Series, January average temperature, 1991 to 2020 (Florida file shown; one file per state). January 1991 to January 2020. Accessed 2026-10-07.
- [21] U.S. Bureau of Labor Statistics. Job Openings and Labor Turnover Survey home page (August 2026 release, September 29, 2026). August 2026. Accessed 2026-10-07.
- [22] U.S. Bureau of Labor Statistics. Producer Price Index series catalog wp.series. October 2026 catalog. Accessed 2026-10-07.
Tier 2: trade bodies, market research, company data (2)
- [19] Associated General Contractors of America. Construction Employment Increased By 33,000 In January As Nonresidential Hiring Drives Modest Growth (February 11, 2026). January 2026. Accessed 2026-10-07.
- [20] Associated Builders and Contractors. Weather, Additional Issues Lead to 3.2 Percent Decline in Construction Backlog Indicator. First quarter 2015. Accessed 2026-10-07.