
Construction Company Financials: Margins and Backlog at 13 Listed U.S. Contractors
- Primary data
- SEC EDGAR XBRL companyfacts and Form 10-K / 10-Q filings for 13 companies; Census Construction Spending
- Data period
- Latest fiscal year (mostly calendar 2025) and quarter to June 30, 2026
- Latest release used
- 2026-08-11
- Next release
- Q3 2026 10-Qs, October to November 2026
- Geography
- United States (company-wide figures)
- Sources
- 32 (32 Tier 1)
Construction company financials for 13 large U.S.-listed contractors show a 6.4% revenue-weighted operating margin and 4.5% net margin in the latest fiscal year, mostly 2025. Margins ranged from 16.3% at Sterling Infrastructure to -2.4% at Fluor. MEP specialists averaged 10.6%, general builders 5.2%. Contracted backlog rose 17.2%, outpacing 12.5% revenue growth.
Construction company financials side by side: 13 listed contractors
Across 13 U.S.-listed contractors, revenue grew 12.5% and the revenue-weighted operating margin was 6.4% in the latest fiscal year. The spread between companies is wide: operating margins span 18.7 percentage points.
| Company (ticker) | Group | Fiscal year | Revenue ($ millions) | Revenue growth (%) | Operating margin (%) | Net margin (%) | RPO at year-end ($ millions) | RPO growth (%) | RPO / revenue (years) |
|---|---|---|---|---|---|---|---|---|---|
| Quanta Services (PWR) | Infrastructure specialty | FY2025 | 28,479.7 | 20.3 | 5.7 | 3.6 | 23,760.0 | 41.8 | 0.83 |
| EMCOR Group (EME) | MEP specialty | FY2025 | 16,986.4 | 16.6 | 10.1 | 7.5 | 13,253.7 | 31.2 | 0.78 |
| AECOM (ACM) | Design and EPC (labelled) | FY2025 (Oct 2024 to Sep 2025) | 16,139.6 | 0.2 | 6.4 | 3.5 | 19,700.0 | -0.5 | 1.22 |
| Fluor (FLR) | Design and EPC (labelled) | FY2025 | 15,503.0 | -5.0 | -2.4 | -0.3 | 24,321.0 | -7.5 | 1.57 |
| Comfort Systems USA (FIX) | MEP specialty | FY2025 | 9,101.6 | 29.5 | 14.4 | 11.2 | 11,944.6 | 99.3 | 1.31 |
| APi Group (APG) | MEP specialty | FY2025 | 7,911.0 | 12.7 | 7.0 | 3.8 | 3,605.0 | 18.6 | 0.46 |
| Primoris Services (PRIM) | Infrastructure specialty | FY2025 | 7,574.9 | 19.0 | 5.4 | 3.6 | 5,300.0 | -15.9 | 0.70 |
| Tutor Perini (TPC) | General and civil builder | FY2025 | 5,543.0 | 28.1 | 4.2 | 1.5 | 16,900.0 | 21.6 | 3.05 |
| Granite Construction (GVA) | General and civil builder | FY2025 | 4,424.4 | 10.4 | 6.4 | 4.4 | 4,123.1 | 15.0 | 0.93 |
| MYR Group (MYRG) | Infrastructure specialty | FY2025 | 3,657.9 | 8.8 | 4.6 | 3.2 | 2,515.9 | 7.6 | 0.69 |
| IES Holdings (IESC) | MEP specialty | FY2025 (Oct 2024 to Sep 2025) | 3,371.5 | 16.9 | 11.4 | 9.1 | 1,686.6 | 43.5 | 0.50 |
| Sterling Infrastructure (STRL) | Infrastructure specialty | FY2025 | 2,490.0 | 17.7 | 16.3 | 11.7 | 3,010.9 | 77.8 | 1.21 |
| Limbach Holdings (LMB) | MEP specialty | FY2025 | 646.8 | 24.7 | 7.7 | 6.0 | 376.1 | 9.3 | 0.58 |
| All 13 combined | Mixed | 121,829.8 | 12.5 | 6.4 | 4.5 | 130,496.9 | 17.2 | 1.07 |
GAAP revenue, operating income and net income attributable to the company from each 10-K (XBRL). RPO = remaining performance obligations, the GAAP measure of firm contract value not yet earned. Tutor Perini, Comfort Systems and Limbach RPO read from filing text; Comfort Systems' December 2024 figure is its reported backlog. AECOM and Fluor are labelled: AECOM is mainly design and consulting, Fluor is an engineering, procurement and construction (EPC) firm. Not investment advice.
Source: [1][3][5][7][9][11][13][15][17][19][21][23][25][32] EMCOR Group, Inc. via SEC EDGAR; COMFORT SYSTEMS USA, INC. via SEC EDGAR; IES Holdings, Inc. via SEC EDGAR; LIMBACH HOLDINGS, INC. via SEC EDGAR; APi Group Corporation via SEC EDGAR; QUANTA SERVICES, INC. via SEC EDGAR; MYR GROUP INC. via SEC EDGAR; Primoris Services Corporation via SEC EDGAR; STERLING INFRASTRUCTURE, INC. via SEC EDGAR; Tutor Perini Corporation via SEC EDGAR; GRANITE CONSTRUCTION INC via SEC EDGAR; AECOM via SEC EDGAR; FLUOR CORPORATION via SEC EDGAR; Limbach Holdings via SEC EDGAR
The table compares GAAP figures from each company's latest annual report on Form 10-K, filed with the SEC between November 2025 and March 2026. Eleven companies close their fiscal year in December; IES Holdings and AECOM close in September, so their latest year runs from October 2024 to September 2025.
The 13 companies booked $121.8 billion in combined revenue, $7.8 billion in operating income and $5.4 billion in net income attributable to shareholders. Quanta Services alone accounted for $28.5 billion of revenue (10-K).
Remaining performance obligations (RPO) at fiscal year-end totalled $130.5 billion, or 1.07 years of combined revenue. RPO is the GAAP disclosure of contract value not yet earned; it is the closest thing to a like-for-like backlog figure across companies.
Operating margin: Operating income divided by revenue. Operating income is revenue minus the cost of the work and overhead, before interest and income tax. Here it is the GAAP figure, including one-time charges and gains.
Net margin: Net income attributable to the company divided by revenue, after interest, taxes, non-operating items and minority interests.
Operating margin ranking: who earns the most per dollar of work
3 companies earned more than 11% operating margins in their latest fiscal year: Sterling Infrastructure, Comfort Systems USA and IES Holdings. 8 of 13 sat between 4% and 8%, and Fluor lost money at the operating line.
GAAP operating income as a share of revenue, latest fiscal year (mostly calendar 2025)
Source: company Form 10-K filings via SEC EDGAR XBRL; CB&C calculation
Sterling Infrastructure's 16.3% margin came with a shift toward its E-Infrastructure Solutions segment, whose 2025 revenue rose 58.8%, mainly on data center volume, according to its 10-K. Comfort Systems' margin of 14.4% compares with 10.7% a year earlier.
At the bottom, Tutor Perini returned to an operating profit of $232.0 million in 2025 (4.2% margin) after an operating loss of $103.8 million in 2024. Fluor's $378.0 million operating loss in 2025 came in a year that included a $643 million revenue reversal tied to a court judgment on the long-completed Santos project in Australia (10-K).
| Company (ticker) | Operating margin, FY2024 (%) | Operating margin, FY2025 (%) | Change (percentage points) | Net income FY2024 ($ millions) | Net income FY2025 ($ millions) |
|---|---|---|---|---|---|
| Tutor Perini (TPC) | -2.4 | 4.2 | 6.6 | -163.7 | 80.4 |
| Sterling Infrastructure (STRL) | 12.5 | 16.3 | 3.8 | 257.5 | 290.2 |
| Comfort Systems USA (FIX) | 10.7 | 14.4 | 3.7 | 522.4 | 1,022.6 |
| MYR Group (MYRG) | 1.6 | 4.6 | 3.0 | 30.3 | 118.4 |
| AECOM (ACM) | 5.1 | 6.4 | 1.3 | 402.3 | 561.8 |
| Granite Construction (GVA) | 5.2 | 6.4 | 1.2 | 126.3 | 193.0 |
| IES Holdings (IESC) | 10.4 | 11.4 | 1.0 | 219.1 | 306.0 |
| EMCOR Group (EME) | 9.2 | 10.1 | 0.9 | 1,007.1 | 1,272.8 |
| Primoris Services (PRIM) | 5.0 | 5.4 | 0.4 | 180.9 | 274.9 |
| Limbach Holdings (LMB) | 7.4 | 7.7 | 0.3 | 30.9 | 39.1 |
| APi Group (APG) | 6.9 | 7.0 | 0.1 | 250.0 | 302.0 |
| Quanta Services (PWR) | 5.7 | 5.7 | 0.0 | 904.8 | 1,028.4 |
| Fluor (FLR) | 2.8 | -2.4 | -5.2 | 2,145.0 | -51.0 |
FY2024 and FY2025 are fiscal years ending September 30 for IES Holdings and AECOM. Net income is attributable to the company. Fluor's FY2024 net income includes gains related to its NuScale holding.
Source: [1][3][5][7][9][11][13][15][17][19][21][23][25] EMCOR Group, Inc. via SEC EDGAR; COMFORT SYSTEMS USA, INC. via SEC EDGAR; IES Holdings, Inc. via SEC EDGAR; LIMBACH HOLDINGS, INC. via SEC EDGAR; APi Group Corporation via SEC EDGAR; QUANTA SERVICES, INC. via SEC EDGAR; MYR GROUP INC. via SEC EDGAR; Primoris Services Corporation via SEC EDGAR; STERLING INFRASTRUCTURE, INC. via SEC EDGAR; Tutor Perini Corporation via SEC EDGAR; GRANITE CONSTRUCTION INC via SEC EDGAR; AECOM via SEC EDGAR; FLUOR CORPORATION via SEC EDGAR
Margins widened at 11 of 13 companies between the two fiscal years. MYR Group's margin rose 3.0 points to 4.6% and Tutor Perini's rose 6.6 points. Fluor's fell 5.2 points and Primoris' fell 0.4 points.
Net margins are thinner: the revenue-weighted figure was 4.5% and the median 3.8%. Sterling (11.7%) and Comfort Systems (11.2%) were the only two above 10%. For how these compare with private contractors, see construction profit margins.
MEP specialty contractors vs general builders: the margin gap
The five MEP and fire specialists earned a revenue-weighted 10.6% operating margin, roughly double the 5.2% of the two general and civil builders. Infrastructure specialists sat between them at 6.2%.
| Group | Companies | Combined revenue ($ millions) | Revenue growth (%) | Operating margin, weighted (%) | Operating margin, median (%) | Net margin, weighted (%) | RPO growth (%) | RPO / revenue (years) |
|---|---|---|---|---|---|---|---|---|
| MEP specialty | EME, FIX, IESC, LMB, APG | 38,017.3 | 18.7 | 10.6 | 10.1 | 7.7 | 49.4 | 0.81 |
| Infrastructure specialty | PWR, MYRG, PRIM, STRL | 42,202.5 | 18.8 | 6.2 | 5.6 | 4.1 | 27.7 | 0.82 |
| General and civil builder | TPC, GVA | 9,967.4 | 19.6 | 5.2 | 5.3 | 2.7 | 20.2 | 2.11 |
| Design and EPC (labelled) | ACM, FLR | 31,642.6 | -2.4 | 2.0 | 2.0 | 1.6 | -4.5 | 1.39 |
| All 13 | 121,829.8 | 12.5 | 6.4 | 6.4 | 4.5 | 17.2 | 1.07 |
Weighted = group sum of operating (or net) income divided by group sum of revenue. Groups are CB&C classifications based on each company's own business description in its 10-K. The general and civil builder group has only two members.
Source: [1][3][5][7][9][11][13][15][17][19][21][23][25] EMCOR Group, Inc. via SEC EDGAR; COMFORT SYSTEMS USA, INC. via SEC EDGAR; IES Holdings, Inc. via SEC EDGAR; LIMBACH HOLDINGS, INC. via SEC EDGAR; APi Group Corporation via SEC EDGAR; QUANTA SERVICES, INC. via SEC EDGAR; MYR GROUP INC. via SEC EDGAR; Primoris Services Corporation via SEC EDGAR; STERLING INFRASTRUCTURE, INC. via SEC EDGAR; Tutor Perini Corporation via SEC EDGAR; GRANITE CONSTRUCTION INC via SEC EDGAR; AECOM via SEC EDGAR; FLUOR CORPORATION via SEC EDGAR
MEP specialists (EMCOR, Comfort Systems, IES Holdings, Limbach and APi Group) design, install and service building systems: electrical, HVAC, plumbing, fire protection. Their combined revenue of $38.0 billion grew 18.7% and their median operating margin was 10.1%.
The general and civil builders, Tutor Perini and Granite, earned 5.2% on $10.0 billion of revenue. A general contractor passes much of each contract to subcontractors, so its revenue includes trade work on which it earns a thin fee; MEP firms self-perform more of the work they bill.
Demand mix also matters. EMCOR's network and communications sector, which includes data centers, supplied 48% of its U.S. electrical construction revenue in 2025 (10-K). At Comfort Systems, technology customers supplied 45.0% of revenue. For the project pipeline, see data center construction projects.
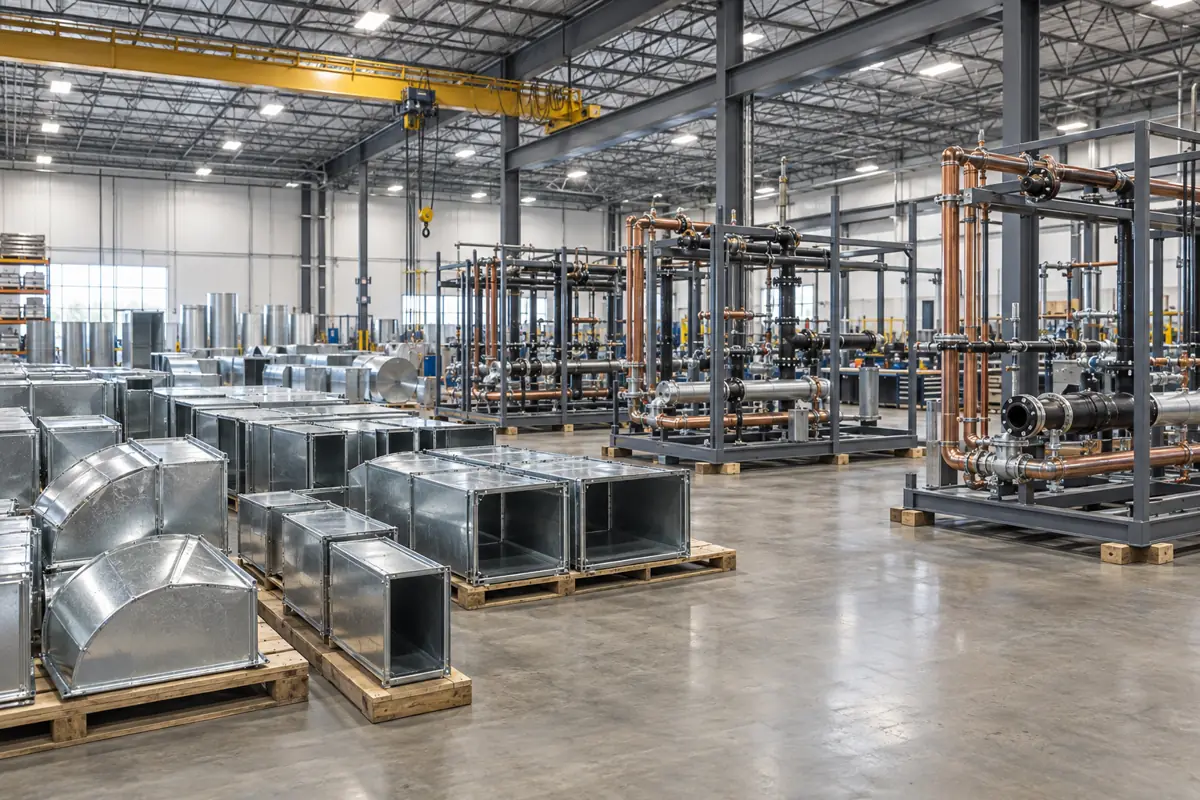
The gap is not uniform. Limbach (7.7%) and APi Group (7.0%) earned margins closer to Granite (6.4%) than to Comfort Systems. Group averages rest on small samples: the general and civil builder group has two members, so one company's charges or recoveries can swing it.
Construction backlog: years of contracted work in hand
Dividing RPO by annual revenue gives a rough measure of how many years of work a contractor has under contract. The median is 0.83 years. Tutor Perini, a large civil and building contractor, is the outlier at 3.05 years.
Remaining performance obligations divided by latest fiscal-year revenue
Source: company Form 10-K filings via SEC EDGAR; CB&C calculation
Construction backlog: The value of work a contractor has won but not yet performed. Companies define it themselves, so it can include signed contracts, awards not yet signed, and estimates of future orders under master service agreements (MSAs).
Remaining performance obligations (RPO): A GAAP disclosure required by the revenue recognition standard: the transaction price of firm contracts for work not yet performed, excluding unexercised options. It is narrower than most backlog figures and more comparable across companies.
Long ratios reflect long projects. Tutor Perini says it typically recognizes revenue on Civil segment projects over three to five years, and expects about 29% of its year-end 2025 backlog to turn into 2026 revenue (10-K). Fluor (1.57 years) and AECOM (1.22) also hold more than a year of RPO.
Short ratios do not mean weak demand. Service-heavy firms such as APi Group (0.46 years) earn much of their revenue from inspection, maintenance and short jobs that never sit in RPO. IES Holdings (0.50) reports a larger backlog of $2.37 billion once signed agreements and letters of intent are added.
| Company (ticker) | RPO ($ millions) | Headline backlog ($ millions) | Company backlog measure | Backlog / RPO | RPO / revenue (years) | Backlog / revenue (years) |
|---|---|---|---|---|---|---|
| Tutor Perini (TPC) | 16,900.0 | 20,559.8 | Backlog (incl. awards not yet contracted) | 1.22 | 3.05 | 3.71 |
| Fluor (FLR) | 24,321.0 | 25,536.0 | Backlog | 1.05 | 1.57 | 1.65 |
| Comfort Systems USA (FIX) | 11,944.6 | 11,944.6 | Backlog (equals RPO) | 1.00 | 1.31 | 1.31 |
| AECOM (ACM) | 19,700.0 | 39,700.0 | Backlog (incl. unsigned awards, JV share) | 2.02 | 1.22 | 2.46 |
| Sterling Infrastructure (STRL) | 3,010.9 | 3,010.0 | Backlog (equals RPO) | 1.00 | 1.21 | 1.21 |
| Granite Construction (GVA) | 4,123.1 | 6,969.4 | Committed and awarded projects (CAP) | 1.69 | 0.93 | 1.58 |
| Quanta Services (PWR) | 23,760.0 | 43,980.0 | Backlog (RPO + estimated MSA orders) | 1.85 | 0.83 | 1.54 |
| EMCOR Group (EME) | 13,253.7 | 13,253.7 | RPO (used as backlog) | 1.00 | 0.78 | 0.78 |
| Primoris Services (PRIM) | 5,300.0 | 11,945.3 | Total backlog (fixed + MSA to agreement end) | 2.25 | 0.70 | 1.58 |
| MYR Group (MYRG) | 2,515.9 | 2,824.3 | Backlog | 1.12 | 0.69 | 0.77 |
| Limbach Holdings (LMB) | 376.1 | 397.6 | Backlog (ODR + GCR) | 1.06 | 0.58 | 0.61 |
| IES Holdings (IESC) | 1,686.6 | 2,373.8 | Backlog (incl. signed agreements and letters of intent) | 1.41 | 0.50 | 0.70 |
| APi Group (APG) | 3,605.0 | n/a | No separate backlog in 10-K | n/a | 0.46 | n/a |
Headline backlog is a non-GAAP, company-defined measure. Where a company reports RPO as its backlog, the two columns match. Comfort Systems reports backlog equal to RPO; its figure appears in both columns. Sorted by RPO-to-revenue ratio.
Source: [1][3][5][7][9][11][13][15][17][19][21][23][25] EMCOR Group, Inc. via SEC EDGAR; COMFORT SYSTEMS USA, INC. via SEC EDGAR; IES Holdings, Inc. via SEC EDGAR; LIMBACH HOLDINGS, INC. via SEC EDGAR; APi Group Corporation via SEC EDGAR; QUANTA SERVICES, INC. via SEC EDGAR; MYR GROUP INC. via SEC EDGAR; Primoris Services Corporation via SEC EDGAR; STERLING INFRASTRUCTURE, INC. via SEC EDGAR; Tutor Perini Corporation via SEC EDGAR; GRANITE CONSTRUCTION INC via SEC EDGAR; AECOM via SEC EDGAR; FLUOR CORPORATION via SEC EDGAR
Headline backlog exceeded RPO by the widest margin at AECOM ($39.7 billion vs $19.7 billion), Primoris (2.25 times) and Quanta (1.85 times), where MSA renewals and unsigned awards are counted. Comparing headline backlog across companies without this adjustment overstates differences.
Revenue growth vs backlog growth
RPO grew faster than revenue at 7 of 13 companies. When contracted work grows faster than the work being performed, the pipeline is filling; when it grows more slowly, firms are burning through backlog.
Combined revenue growth vs combined RPO growth by group, latest fiscal year (%)
Source: company Form 10-K filings via SEC EDGAR; CB&C calculation
The MEP group's RPO grew 49.4% against 18.7% revenue growth. Comfort Systems (99.3% RPO growth vs 29.5% revenue growth) and Sterling (77.8% vs 17.7%) show the widest gaps. Both figures include acquisitions: Sterling's year-end backlog included $488.9 million from an electrical and mechanical business bought in 2025.
RPO grew more slowly than revenue, or shrank, at 6 companies. Primoris' RPO fell 15.9% while revenue rose 19.0%; Fluor's RPO fell 7.5%; AECOM's slipped 0.5%. Limbach (9.3% vs 24.7%), Tutor Perini (21.6% vs 28.1%) and MYR Group (7.6% vs 8.8%) added RPO more slowly than revenue.
Revenue growth: latest fiscal year vs quarter to June 2026 (year over year, %)
Source: company Form 10-K and Form 10-Q filings via SEC EDGAR XBRL; CB&C calculation
Revenue growth in the quarter to June 2026 exceeded the latest fiscal-year rate at 9 of 13 companies. The median quarterly growth rate was 20.1%, against a fiscal-year median of 16.9%.
What the latest quarter (to June 2026) shows
Second-quarter 2026 filings show demand still concentrated in power, data center and MEP work. Median RPO growth was 22.9% year over year, but two companies posted quarterly operating losses tied to specific projects or segments.
| Company (ticker) | Quarter revenue ($ millions) | Revenue growth vs year-ago (%) | Operating margin (%) | Year-ago operating margin (%) | RPO at 2026-06-30 ($ millions) | RPO growth vs 2025-06-30 (%) |
|---|---|---|---|---|---|---|
| Sterling Infrastructure (STRL) | 1,168.2 | 90.1 | 18.8 | 17.0 | 4,233.6 | 110.8 |
| Comfort Systems USA (FIX) | 3,265.7 | 50.3 | 17.1 | 13.8 | 14,061.5 | 73.1 |
| Quanta Services (PWR) | 9,557.0 | 41.1 | 7.3 | 5.5 | 33,550.0 | 75.1 |
| IES Holdings (IESC) | 1,242.7 | 39.6 | 14.4 | 12.6 | 2,801.6 | 116.3 |
| Granite Construction (GVA) | 1,455.9 | 29.3 | 8.7 | 9.2 | 5,056.5 | 22.9 |
| Limbach Holdings (LMB) | 173.5 | 22.0 | 4.2 | 7.5 | 463.3 | 48.6 |
| MYR Group (MYRG) | 1,081.7 | 20.1 | 6.3 | 4.4 | 2,826.9 | 21.2 |
| EMCOR Group (EME) | 5,154.9 | 19.8 | 10.6 | 9.6 | 17,143.1 | 43.9 |
| Tutor Perini (TPC) | 1,637.0 | 19.2 | 7.2 | 5.6 | 16,600.0 | 2.5 |
| APi Group (APG) | 2,254.0 | 13.3 | 7.8 | 7.2 | 4,066.0 | 6.8 |
| Fluor (FLR) | 4,329.0 | 8.8 | 3.1 | -0.7 | 25,861.0 | -3.6 |
| Primoris Services (PRIM) | 1,688.2 | -10.7 | -1.6 | 6.7 | 6,000.0 | 13.2 |
| AECOM (ACM) | 3,586.1 | -14.2 | -2.1 | 7.0 | 20,400.0 | 14.0 |
Quarter ended June 30, 2026 for calendar-year companies; fiscal Q3 2026 for IES Holdings (ended June 30) and AECOM (ended July 3, tagged as June 30 in XBRL). Unaudited. Sorted by revenue growth.
Source: [2][4][6][8][10][12][14][16][18][20][22][24][26][31] EMCOR Group, Inc. via SEC EDGAR; COMFORT SYSTEMS USA, INC. via SEC EDGAR; IES Holdings, Inc. via SEC EDGAR; LIMBACH HOLDINGS, INC. via SEC EDGAR; APi Group Corporation via SEC EDGAR; QUANTA SERVICES, INC. via SEC EDGAR; MYR GROUP INC. via SEC EDGAR; Primoris Services Corporation via SEC EDGAR; STERLING INFRASTRUCTURE, INC. via SEC EDGAR; Tutor Perini Corporation via SEC EDGAR; GRANITE CONSTRUCTION INC via SEC EDGAR; AECOM via SEC EDGAR; FLUOR CORPORATION via SEC EDGAR; Limbach Holdings via SEC EDGAR
IES Holdings (116.3%), Sterling (110.8%), Quanta (75.1%) and Comfort Systems (73.1%) reported the fastest year-over-year RPO growth to June 30, 2026 (IES 10-Q, Quanta 10-Q).
AECOM's quarterly operating margin was -2.1% after a $336.8 million loss on a delayed Construction Management project (10-Q). Primoris' operating margin was -1.6%, with gross margin at 4.9% against 12.3% a year earlier (10-Q).
Tutor Perini's backlog fell to $19.9 billion at June 30, 2026 from $21.1 billion a year earlier, while its quarterly operating margin rose to 7.2% from 5.6% (10-Q).
What the filings say about the commercial construction market
Listed contractors are growing much faster than the market they serve. Census private nonresidential spending fell 1.7% in 2025 and 4.8% in the first eight months of 2026, but data center construction rose 42.8% and 41.7%. The listed firms are concentrated in the segments that are growing.
Change in U.S. private construction put in place, 2025 vs 2024 (%)
Source: U.S. Census Bureau, Construction Spending, August 2026 release (sum of NSA months)
| Category | 2024 ($ billions) | 2025 ($ billions) | Change 2025 (%) | Jan to Aug 2025 ($ billions) | Jan to Aug 2026 ($ billions) | Change YTD (%) |
|---|---|---|---|---|---|---|
| Data center | 34.8 | 49.7 | 42.8 | 31.9 | 45.2 | 41.7 |
| Office (includes data center) | 91.7 | 104.3 | 13.7 | 68.4 | 77.9 | 13.9 |
| Health care | 55.5 | 59.3 | 6.8 | 39.5 | 37.4 | -5.3 |
| Power | 146.7 | 152.0 | 3.6 | 100.3 | 106.0 | 5.7 |
| All private nonresidential | 797.1 | 783.7 | -1.7 | 524.2 | 499.3 | -4.8 |
| Commercial (retail, warehouse, farm) | 131.1 | 122.5 | -6.6 | 82.0 | 77.5 | -5.5 |
| Manufacturing | 243.4 | 213.8 | -12.2 | 147.3 | 114.6 | -22.2 |
Sums of not seasonally adjusted monthly values from the Census Bureau's August 2026 release. Data center is a subcategory of office. Recent months are preliminary.
The 13 firms' combined revenue grew 12.5% in their latest fiscal year, 14.2 percentage points above the change in U.S. private nonresidential construction put in place (Census). Part of the difference is acquisitions, part is non-U.S. and non-building work, and part is mix: power (3.6%) and data center (42.8%) construction grew while manufacturing (-12.2%) and commercial (-6.6%) shrank.
For general building, the signals are mixed. Tutor Perini's Building segment backlog rose 4.4% in 2025 to $7.3 billion, and Fluor's Urban Solutions segment backlog stood at $18.7 billion. Private health care construction rose 6.8% in 2025 but fell 5.3% in January to August 2026.
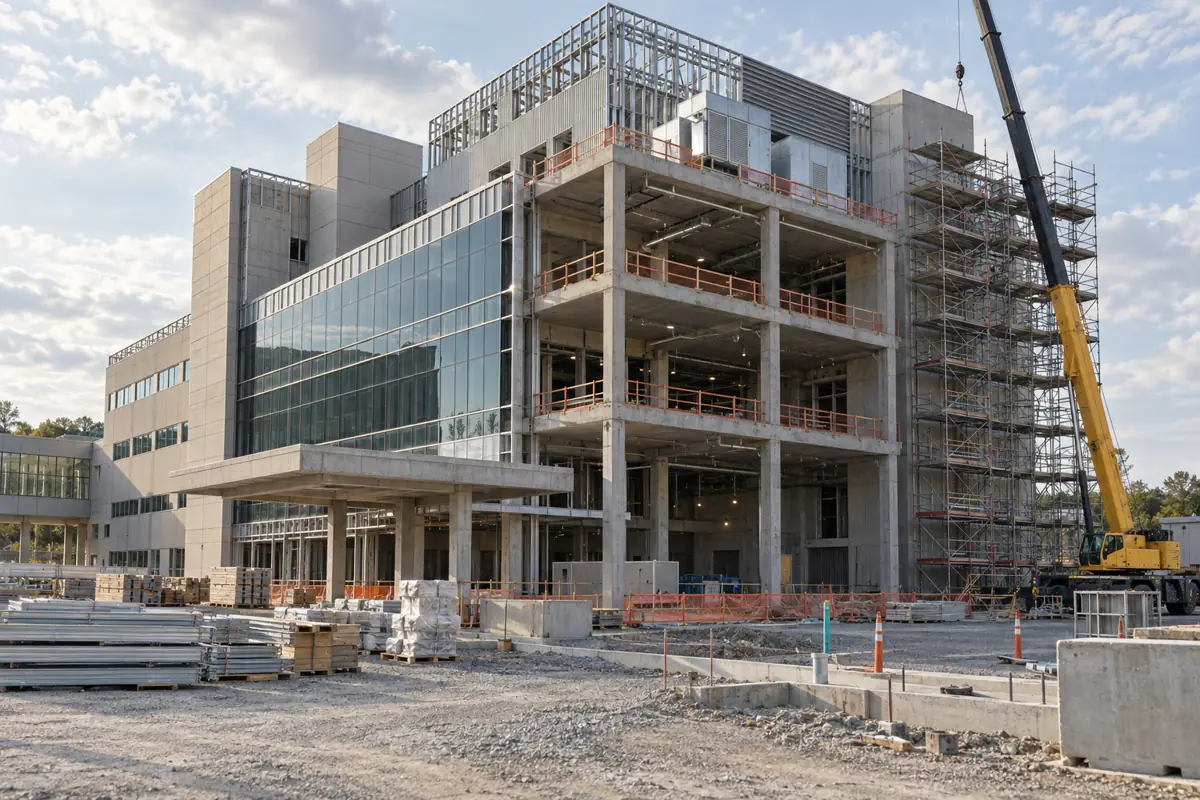
Large listed firms are a small slice of the industry. Most commercial building revenue goes to private and smaller firms, as shown in construction industry concentration; for the full spending series, see commercial construction spending. The listed group's margins and backlog therefore describe the top of the market, not the typical contractor.
How to read contractor financials: comparability limits
Public filings are audited and dated, but the companies do different work, close their books on different dates and define backlog differently. These limits matter more than small differences in the numbers.
- Business mix: AECOM describes itself as a provider of professional infrastructure consulting and advisory services; Fluor is an EPC firm reporting Urban Solutions, Energy Solutions and Mission Solutions segments. Both are labelled and grouped separately.
- Fiscal years: IES Holdings and AECOM close on September 30; the rest on December 31.
- Acquisitions: growth rates include acquired revenue and backlog. Several firms, including EMCOR, Comfort Systems and Sterling, closed acquisitions during the period.
- One-time items: GAAP operating income includes project charges, legal judgments and gains. Fluor's 2025 result and AECOM's fiscal Q3 2026 result include large project-specific items.
- Backlog definitions: RPO is comparable in principle but companies apply different exclusions; headline backlog adds unsigned awards and MSA estimates.
- Geography: figures are company-wide and include non-U.S. operations where companies have them.
Ratios behind the comparison
Operating margin ranking
Formulaoperating income / revenue x 100 for each company, latest fiscal year; ranked
Inputs: operating income and revenue rows for 13 companies in fact_sheet.csv (see derived_metrics.csv ids *:opm) (fact sheet rows)
Result: Sterling Infrastructure 16.3%; Comfort Systems USA 14.4%; IES Holdings 11.4%; median 6.4%; weighted 6.4%; lowest Fluor -2.4%
Firms focused on data center, power and building systems work earned the highest margins; diversified builders and EPC firms the lowest.
Limitations: GAAP figures include one-time items; fiscal years differ for IES Holdings and AECOM.
MEP specialty vs general builder margin gap
Formulasum(operating income) / sum(revenue) for each group; MEP minus general and civil
Inputs: EME, FIX, IESC, LMB, APG vs TPC, GVA operating income and revenue rows (derived ids grp:mep:opm, grp:general:opm) (fact sheet rows)
Result: 10.6% vs 5.2%: gap of 5.4 percentage points
Self-performing specialty trades earned about twice the margin of general and civil builders on each dollar of revenue.
Limitations: Two-company comparison group; Granite also sells construction materials; group assignment is CB&C's.
Revenue growth vs RPO growth
FormulaRPO growth (FY end vs prior FY end) minus revenue growth (FY vs prior FY), percentage points
Inputs: RPO and revenue rows for 13 companies (derived ids *:gap, agg:rpo_growth, agg:growth) (fact sheet rows)
Result: Combined RPO +17.2% vs revenue +12.5%; 7 of 13 companies grew RPO faster
Contracted work is building faster than it is being burned at most specialty firms, which points to continued revenue growth if projects proceed.
Limitations: Includes acquired backlog; RPO for three companies read from filing text; Comfort Systems' 2024 base is its reported backlog.
Backlog-to-revenue ratio (years of work)
FormulaRPO at fiscal year-end / fiscal-year revenue
Inputs: RPO and revenue rows (derived ids *:rpo_years, med:rpo_years, agg:rpo_years) (fact sheet rows)
Result: Median 0.83 years; combined 1.07; Tutor Perini 3.05; APi Group 0.46
Most listed specialty contractors have less than one year of revenue under firm contract; civil-heavy and EPC firms hold more.
Limitations: Ignores service and MSA revenue that does not enter RPO; assumes flat revenue.
Listed contractors vs the market
Formulacombined revenue growth of 13 firms minus Census private nonresidential construction growth, 2025
Inputs: agg:growth; Census nonresidential 2024 and 2025 rows (fact sheet rows)
Result: 12.5% vs -1.7%: gap of 14.2 percentage points
Listed firms are concentrated in growing segments (data centers, power) and are adding revenue by acquisition while the broad private nonresidential market contracted.
Limitations: Company revenue includes non-U.S., public-sector and infrastructure work that Census private nonresidential does not cover.
Headline backlog vs RPO
Formulacompany-reported backlog / RPO at the same date
Inputs: backlog and RPO rows for 12 companies (derived ids *:bl_vs_rpo) (fact sheet rows)
Result: Quanta 1.85x, Primoris 2.25x, AECOM 2.02x, Tutor Perini 1.22x; EMCOR, Comfort Systems and Sterling 1.00x
Headline backlog figures are not comparable without this adjustment; RPO is the safer cross-company measure.
Limitations: APi Group reports no separate backlog figure in its 10-K.
Where the numbers diverge
- Combined revenue of the 13 contractors was $121.8 billion in their latest fiscal year, up 12.5% from $108.3 billion (company 10-K filings, mostly calendar 2025).[1][3][5][7][9][11][13][15][17][19][21][23][25]
- Quanta Services was the largest by revenue at $28.5 billion in 2025, followed by EMCOR at $17.0 billion and AECOM at $16.1 billion (FY ended September 2025).[11][1][23]
- Sterling Infrastructure had the highest 2025 operating margin at 16.3%, followed by Comfort Systems USA at 14.4% and IES Holdings at 11.4% (FY to September 2025).[17][3][5]
- Fluor reported a 2025 operating loss of $378.0 million (-2.4% margin) in a year that included a $643 million reversal of previously recognized revenue for a judgment on its Santos project.[25]
- Five MEP and fire specialists earned a combined 10.6% operating margin in the latest fiscal year, against 5.2% for Tutor Perini and Granite combined: a gap of 5.4 percentage points.[1][3][5][7][9][19][21]
- The MEP group's 10.6% margin is 4.1 points above the 6.49% pre-tax operating margin for 48 U.S. listed engineering and construction firms in the January 2026 NYU Stern dataset.[30][1][3]
- Comfort Systems' operating margin rose from 10.7% in 2024 to 14.4% in 2025, and its backlog nearly doubled, up 99.3% to $11.94 billion; technology customers supplied 45.0% of 2025 revenue.[3]
- Combined RPO rose 17.2% to $130.5 billion at the latest fiscal year-end, faster than the 12.5% rise in revenue.[1][3][5][7][9][11][13][15][17][19][21][23][25]
- Tutor Perini's RPO equalled 3.05 years of 2025 revenue and its headline backlog of $20.6 billion equalled 3.71 years, the longest runway in the group.[19]
- The median RPO-to-revenue ratio was 0.83 years; APi Group (0.46) and IES Holdings (0.50) had the shortest contracted runways.[9][5]
- Company-defined backlog can be far larger than GAAP RPO: Quanta reported backlog of $44.0 billion against RPO of $23.8 billion (1.85 times), and Primoris $11.9 billion against $5.3 billion.[11][15]
- U.S. private nonresidential construction spending fell 1.7% in 2025 while the 13 firms grew revenue 12.5%, a gap of 14.2 percentage points (Census Bureau, August 2026 release).[28][1]
- Private data center construction rose 42.8% in 2025 and 41.7% in January to August 2026, while manufacturing construction fell 12.2% and 22.2%.[28]
- In the quarter to June 2026, Sterling's revenue rose 90.1% and Comfort Systems' 50.3% year over year, while AECOM's fell 14.2% and Primoris' fell 10.7%.[18][4][24][16]
Summary
- The 13 companies reported combined revenue of $121.8 billion in their latest fiscal year, up 12.5%; the median company grew 16.9%.
- Revenue-weighted operating margin was 6.4% and net margin 4.5%; 12 of 13 companies had positive operating income.
- Sterling Infrastructure (16.3%), Comfort Systems USA (14.4%) and IES Holdings (11.4%) posted the highest operating margins; Fluor (-2.4%) the lowest.
- Mechanical, electrical and plumbing (MEP) and fire specialists earned a weighted 10.6% operating margin, 5.4 points above the two general and civil builders (5.2%).
- Combined remaining performance obligations (RPO) reached $130.5 billion, up 17.2%, equal to 1.07 years of revenue; 7 of 13 grew RPO faster than revenue.
- Tutor Perini holds the most work relative to its size: RPO of 3.05 years of revenue, against a group median of 0.83 years.
- The market these firms sell into was flat to down: Census private nonresidential construction fell 1.7% in 2025, while data center construction rose 42.8%.
- In the quarter to June 2026 the median company grew revenue 20.1% and RPO 22.9% year over year, though AECOM and Primoris reported quarterly operating losses.
Questions people ask
What are the biggest construction companies in the US?
Among U.S.-listed contractors in this benchmark, Quanta Services was the largest by revenue at $28.5 billion in 2025, followed by EMCOR ($17.0 billion), AECOM ($16.1 billion, fiscal year to September 2025) and Fluor ($15.5 billion). Several large U.S. builders are privately held or foreign-owned and do not file 10-Ks; see construction industry concentration.
What is a typical operating margin for a general contractor?
The two listed general and civil builders, Tutor Perini and Granite, earned a combined 5.2% operating margin in 2025 (4.2% and 6.4%). NYU Stern's January 2026 data put the pre-tax operating margin for 48 listed engineering and construction firms at 6.49%. Private general contractors are covered in construction profit margins.
Which construction stocks have the largest backlog?
By GAAP remaining performance obligations at the latest fiscal year-end, Fluor ($24.3 billion), Quanta ($23.8 billion), AECOM ($19.7 billion) and Tutor Perini ($16.9 billion) led the group. By company-defined backlog, Quanta reported $44.0 billion and AECOM $39.7 billion. These are reported figures, not recommendations.
Are construction companies profitable in 2026?
Most large listed contractors are. In the quarter to June 2026, 11 of 13 reported operating profits; median revenue growth was 20.1%. AECOM (-2.1% margin) and Primoris (-1.6%) reported quarterly operating losses tied to specific projects and segments.
What is construction backlog?
Backlog is the value of contracted work not yet performed. Public companies also report remaining performance obligations (RPO), a narrower GAAP measure. For the 13 firms here, RPO totalled $130.5 billion, or 1.07 years of revenue, at the latest fiscal year-end.
For journalists and researchers
If you cite only a few, cite these
- 13 large U.S.-listed contractors earned a revenue-weighted operating margin of 6.4% in their latest fiscal year (CB&C analysis of 10-K filings, mostly 2025).[1][3][5][7][9][11][13][15][17][19][21][23][25]
- MEP specialty contractors earned a 10.6% operating margin, 5.4 points above general and civil builders at 5.2%.[1][3][19][21]
- Combined remaining performance obligations of the 13 firms rose 17.2% to $130.5 billion.[1][3][5][7][9][11][13][15][17][19][21][23][25]
Most quotable statistics
- 13 large U.S.-listed contractors earned a revenue-weighted operating margin of 6.4% in their latest fiscal year (CB&C analysis of 10-K filings, mostly 2025).[1][3][5][7][9][11][13][15][17][19][21][23][25]
- MEP specialty contractors earned a 10.6% operating margin, 5.4 points above general and civil builders at 5.2%.[1][3][19][21]
- Combined remaining performance obligations of the 13 firms rose 17.2% to $130.5 billion.[1][3][5][7][9][11][13][15][17][19][21][23][25]
- The median large listed contractor held 0.83 years of revenue in firm contracted work at its latest fiscal year-end.[1][3][5][7][9][11][13][15][17][19][21][23][25]
- Listed contractors grew revenue 12.5% while U.S. private nonresidential construction spending fell 1.7% in 2025.[28][1]
- U.S. private data center construction rose 42.8% in 2025, to $49.7 billion (Census Bureau).[28]
Press summary
A CB&C review of SEC filings from 13 large U.S.-listed contractors finds a revenue-weighted operating margin of 6.4% and net margin of 4.5% in the latest fiscal year, mostly calendar 2025. Combined revenue rose 12.5% to $121.8 billion. Sterling Infrastructure (16.3%), Comfort Systems USA (14.4%) and IES Holdings (11.4%) posted the highest operating margins; Fluor reported an operating loss. Mechanical, electrical and fire specialists earned 10.6%, about 5.4 points more than general and civil builders. Remaining performance obligations, the GAAP measure of contracted work, rose 17.2% to $130.5 billion, equal to 1.07 years of revenue. The growth contrasts with the wider market: Census data show U.S. private nonresidential construction spending fell 1.7% in 2025, while data center construction rose 42.8%. Tutor Perini held the longest runway, with RPO equal to 3.05 years of revenue. The report publishes all figures as CSV files under CC BY 4.0. It is not investment advice.
Suggested headlines
- Listed U.S. contractors earned 6.4% operating margins as revenue rose 12.5%
- MEP specialists out-earn general builders by 5.4 points, SEC filings show
- Contracted backlog at 13 big contractors hits $130.5 billion, up 17.2%
- Big contractors grew 12.5% while private nonresidential construction fell 1.7%
- Data center work lifts Sterling and Comfort Systems to the top of contractor margin ranking
How to cite this report
Commercial Builders & Contractors. (2026). Construction Company Financials: Margins and Backlog at 13 Listed U.S. Contractors. Retrieved from https://commercialbuildersandcontractors.com/public-contractor-financial-benchmark/
Reuse license
Data and tables are licensed CC BY 4.0. Attribution: “Source: Commercial Builders & Contractors, Construction Company Financials: Margins and Backlog at 13 Listed U.S. Contractors” with a link to this page.
Download the data
Every table in this report is available as a CSV under CC BY 4.0. The fact sheet lists each value with its source URL and access date.
- derived_metrics.csv (CSV)
- fact_sheet.csv (CSV)
- Construction company financials side by side: 13 U.S.-listed contractors, latest fiscal year (CSV)
- Margin and backlog by contractor type, latest fiscal year (CSV)
- RPO vs company-reported backlog at latest fiscal year-end (CSV)
- Latest quarter (three months to June 30, 2026) vs year-ago quarter (CSV)
- Market backdrop: U.S. private construction put in place by type (CSV)
- Operating margin, prior vs latest fiscal year (CSV)
Frequently asked questions
Which listed contractor had the highest operating margin in 2025?
Sterling Infrastructure, at 16.3% on $2.49 billion of 2025 revenue, followed by Comfort Systems USA at 14.4% (company 10-K filings).
What was the average net margin for large U.S. contractors?
The revenue-weighted net margin for the 13 companies was 4.5% in the latest fiscal year; the median was 3.8%.
How fast did listed contractors grow revenue?
Combined revenue rose 12.5% to $121.8 billion. Comfort Systems (29.5%) and Tutor Perini (28.1%) grew fastest; Fluor's revenue fell 5.0%.
Do MEP contractors earn more than general contractors?
In this group, yes. Five MEP and fire specialists earned a combined 10.6% operating margin, against 5.2% for Tutor Perini and Granite combined.
How many years of work do large contractors have in backlog?
The median ratio of RPO to annual revenue was 0.83 years. Tutor Perini held the most at 3.05 years; APi Group the least at 0.46.
What is the difference between backlog and RPO?
RPO counts only firm, enforceable contracts under GAAP. Backlog is company-defined and may add unsigned awards and estimated MSA orders. Quanta's backlog of $44.0 billion was 1.85 times its RPO of $23.8 billion.
Is commercial construction spending growing?
Not in total. Census private nonresidential construction fell 1.7% in 2025 and 4.8% in January to August 2026, while data center construction rose 42.8% in 2025.
Why did Fluor report a loss in 2025?
Fluor's 10-K reports a $643 million reversal of previously recognized revenue for a judgment on the Santos project in Australia, plus cost growth on infrastructure projects; operating loss was $378.0 million.
How much of Comfort Systems' revenue comes from technology customers?
Technology customers supplied 45.0% of Comfort Systems' 2025 revenue, according to its 10-K, which says demand in that sector was especially strong for data centers. Its backlog reached $14.06 billion at June 30, 2026.
Where does the data in this report come from?
From each company's latest Form 10-K and Form 10-Q, pulled through the SEC EDGAR XBRL companyfacts API and checked against the filing text, plus U.S. Census Bureau construction spending and NYU Stern margin data.
Methodology
Selection. The benchmark covers 13 U.S.-listed companies with a U.S. building, specialty contracting or infrastructure construction focus, chosen from the list in the CB&C brief: Tutor Perini, Granite Construction, Sterling Infrastructure, EMCOR, Comfort Systems USA, Limbach, IES Holdings, MYR Group, Primoris, Quanta Services and APi Group, plus AECOM (design, consulting and construction management) and Fluor (EPC), which are labelled and grouped separately. Privately held and foreign-listed builders are excluded because they do not file 10-Ks.
Data. Revenue, operating income, net income attributable to the company and remaining performance obligations come from the SEC EDGAR XBRL companyfacts API (pulled 2026-10-18), which reproduces the tagged financial statements of each 10-K and 10-Q. Every annual revenue, operating income and net income value was cross-checked against the 10-K text. Tutor Perini, Comfort Systems and Limbach do not tag total RPO in companyfacts; their RPO was read from the revenue note in each filing (Tutor Perini and Limbach as the sum of segment figures). Company-defined backlog was read from each 10-K's business or MD&A section.
Periods. The latest fiscal year is calendar 2025 for 11 companies and October 2024 to September 2025 for IES Holdings and AECOM. The latest quarter is the three months to June 30, 2026 (fiscal Q3 2026 for IES Holdings and AECOM; AECOM's quarter ended July 3, 2026 and is tagged as June 30). Q3 2026 10-Qs and AECOM's and IES Holdings' FY2026 10-Ks had not been filed on 2026-10-18.
Derived metrics. Growth rates are simple percentage changes. Operating and net margins are income divided by revenue. Group and combined margins are revenue-weighted (sum of income divided by sum of revenue); medians are unweighted. RPO-to-revenue divides year-end RPO by fiscal-year revenue. Every formula and its input rows are in derived_metrics.csv.
Conflicts. Where a company reports both RPO and a larger backlog, the benchmark uses RPO for cross-company comparisons and shows backlog separately. Comfort Systems' December 2024 figure is its reported backlog, which the company presents as equal to RPO at December 2025. No figures were adjusted for acquisitions or one-time items.
Market context. Census private construction put in place is the sum of not seasonally adjusted monthly values from the August 2026 release (privtime.xlsx); recent months are preliminary and subject to the annual revision. NYU Stern margins (January 2026) cover a different set of listed firms and serve as context only.
Limitations. Groups are small; company revenue includes non-U.S. and non-building work; backlog definitions vary; GAAP results include large project charges. This report does not rate or recommend any security and is not investment advice. Last updated 2026-10-18.
This report presents published data with its limitations. It is not legal, financial or investment advice.
Sources, ranked by quality
Tier 1: primary and official sources (32)
- [1] EMCOR Group, Inc. via SEC EDGAR. EMCOR Group, Inc.: Form 10-K annual report, fiscal year ended 2025-12-31. fiscal year ended 2025-12-31 (filed 2026-02-26). Accessed 2026-10-18.
- [2] EMCOR Group, Inc. via SEC EDGAR. EMCOR Group, Inc.: Form 10-Q quarterly report, quarter ended 2026-06-30. quarter ended 2026-06-30 (filed 2026-07-30). Accessed 2026-10-18.
- [3] COMFORT SYSTEMS USA, INC. via SEC EDGAR. COMFORT SYSTEMS USA, INC.: Form 10-K annual report, fiscal year ended 2025-12-31. fiscal year ended 2025-12-31 (filed 2026-02-19). Accessed 2026-10-18.
- [4] COMFORT SYSTEMS USA, INC. via SEC EDGAR. COMFORT SYSTEMS USA, INC.: Form 10-Q quarterly report, quarter ended 2026-06-30. quarter ended 2026-06-30 (filed 2026-07-23). Accessed 2026-10-18.
- [5] IES Holdings, Inc. via SEC EDGAR. IES Holdings, Inc.: Form 10-K annual report, fiscal year ended 2025-09-30. fiscal year ended 2025-09-30 (filed 2025-11-21). Accessed 2026-10-18.
- [6] IES Holdings, Inc. via SEC EDGAR. IES Holdings, Inc.: Form 10-Q quarterly report, quarter ended 2026-06-30. quarter ended 2026-06-30 (filed 2026-07-31). Accessed 2026-10-18.
- [7] LIMBACH HOLDINGS, INC. via SEC EDGAR. LIMBACH HOLDINGS, INC.: Form 10-K annual report, fiscal year ended 2025-12-31. fiscal year ended 2025-12-31 (filed 2026-03-02). Accessed 2026-10-18.
- [8] LIMBACH HOLDINGS, INC. via SEC EDGAR. LIMBACH HOLDINGS, INC.: Form 10-Q quarterly report, quarter ended 2026-06-30. quarter ended 2026-06-30 (filed 2026-08-04). Accessed 2026-10-18.
- [9] APi Group Corporation via SEC EDGAR. APi Group Corporation: Form 10-K annual report, fiscal year ended 2025-12-31. fiscal year ended 2025-12-31 (filed 2026-02-25). Accessed 2026-10-18.
- [10] APi Group Corporation via SEC EDGAR. APi Group Corporation: Form 10-Q quarterly report, quarter ended 2026-06-30. quarter ended 2026-06-30 (filed 2026-07-30). Accessed 2026-10-18.
- [11] QUANTA SERVICES, INC. via SEC EDGAR. QUANTA SERVICES, INC.: Form 10-K annual report, fiscal year ended 2025-12-31. fiscal year ended 2025-12-31 (filed 2026-02-19). Accessed 2026-10-18.
- [12] QUANTA SERVICES, INC. via SEC EDGAR. QUANTA SERVICES, INC.: Form 10-Q quarterly report, quarter ended 2026-06-30. quarter ended 2026-06-30 (filed 2026-07-30). Accessed 2026-10-18.
- [13] MYR GROUP INC. via SEC EDGAR. MYR GROUP INC.: Form 10-K annual report, fiscal year ended 2025-12-31. fiscal year ended 2025-12-31 (filed 2026-02-25). Accessed 2026-10-18.
- [14] MYR GROUP INC. via SEC EDGAR. MYR GROUP INC.: Form 10-Q quarterly report, quarter ended 2026-06-30. quarter ended 2026-06-30 (filed 2026-07-29). Accessed 2026-10-18.
- [15] Primoris Services Corporation via SEC EDGAR. Primoris Services Corporation: Form 10-K annual report, fiscal year ended 2025-12-31. fiscal year ended 2025-12-31 (filed 2026-02-24). Accessed 2026-10-18.
- [16] Primoris Services Corporation via SEC EDGAR. Primoris Services Corporation: Form 10-Q quarterly report, quarter ended 2026-06-30. quarter ended 2026-06-30 (filed 2026-08-05). Accessed 2026-10-18.
- [17] STERLING INFRASTRUCTURE, INC. via SEC EDGAR. STERLING INFRASTRUCTURE, INC.: Form 10-K annual report, fiscal year ended 2025-12-31. fiscal year ended 2025-12-31 (filed 2026-02-26). Accessed 2026-10-18.
- [18] STERLING INFRASTRUCTURE, INC. via SEC EDGAR. STERLING INFRASTRUCTURE, INC.: Form 10-Q quarterly report, quarter ended 2026-06-30. quarter ended 2026-06-30 (filed 2026-08-04). Accessed 2026-10-18.
- [19] Tutor Perini Corporation via SEC EDGAR. Tutor Perini Corporation: Form 10-K annual report, fiscal year ended 2025-12-31. fiscal year ended 2025-12-31 (filed 2026-02-26). Accessed 2026-10-18.
- [20] Tutor Perini Corporation via SEC EDGAR. Tutor Perini Corporation: Form 10-Q quarterly report, quarter ended 2026-06-30. quarter ended 2026-06-30 (filed 2026-08-05). Accessed 2026-10-18.
- [21] GRANITE CONSTRUCTION INC via SEC EDGAR. GRANITE CONSTRUCTION INC: Form 10-K annual report, fiscal year ended 2025-12-31. fiscal year ended 2025-12-31 (filed 2026-02-13). Accessed 2026-10-18.
- [22] GRANITE CONSTRUCTION INC via SEC EDGAR. GRANITE CONSTRUCTION INC: Form 10-Q quarterly report, quarter ended 2026-06-30. quarter ended 2026-06-30 (filed 2026-07-30). Accessed 2026-10-18.
- [23] AECOM via SEC EDGAR. AECOM: Form 10-K annual report, fiscal year ended 2025-09-30. fiscal year ended 2025-09-30 (filed 2025-11-19). Accessed 2026-10-18.
- [24] AECOM via SEC EDGAR. AECOM: Form 10-Q quarterly report, quarter ended 2026-07-03. quarter ended 2026-07-03 (filed 2026-08-11). Accessed 2026-10-18.
- [25] FLUOR CORPORATION via SEC EDGAR. FLUOR CORPORATION: Form 10-K annual report, fiscal year ended 2025-12-31. fiscal year ended 2025-12-31 (filed 2026-02-17). Accessed 2026-10-18.
- [26] FLUOR CORPORATION via SEC EDGAR. FLUOR CORPORATION: Form 10-Q quarterly report, quarter ended 2026-06-30. quarter ended 2026-06-30 (filed 2026-08-07). Accessed 2026-10-18.
- [27] U.S. Securities and Exchange Commission. EDGAR application programming interfaces (XBRL companyfacts API documentation). API documentation; data pulled 2026-10-18. Accessed 2026-10-18.
- [28] U.S. Census Bureau. Value of Private Construction Put in Place, Not Seasonally Adjusted (privtime.xlsx). January 2024 to August 2026 (August 2026 release). Accessed 2026-10-18.
- [29] U.S. Census Bureau. Construction Spending: current release (August 2026 data). August 2026 (released October 2026). Accessed 2026-10-18.
- [30] Aswath Damodaran, NYU Stern School of Business. Operating and Net Margins by Sector (US), data as of January 2026. January 2026. Accessed 2026-10-18.
- [31] Limbach Holdings via SEC EDGAR. Limbach Holdings: Form 10-Q, quarter ended 2025-06-30. quarter ended 2025-06-30. Accessed 2026-10-18.
- [32] Limbach Holdings via SEC EDGAR. Limbach Holdings: Form 10-K, fiscal year ended 2024-12-31. fiscal year ended 2024-12-31. Accessed 2026-10-18.