Federal Construction Contracts by State: FY2025 Obligations, Buyers and Top Recipients
- Primary data
- USAspending.gov prime contract transactions (FPDS), NAICS 236220, award types A to D
- Data period
- FY2025 (2024-10-01 to 2025-09-30), compared with FY2024; FY2026 shown as preliminary only
- Latest release used
- 2026-10-03
- Next release
- USAspending updates daily; DoD and USACE records post on a 90-day delay, so FY2026 is expected to be near complete in early January 2027
- Geography
- 50 states, DC and U.S. territories by place of performance; overseas work counted in national totals
- Sources
- 21 (19 Tier 1)
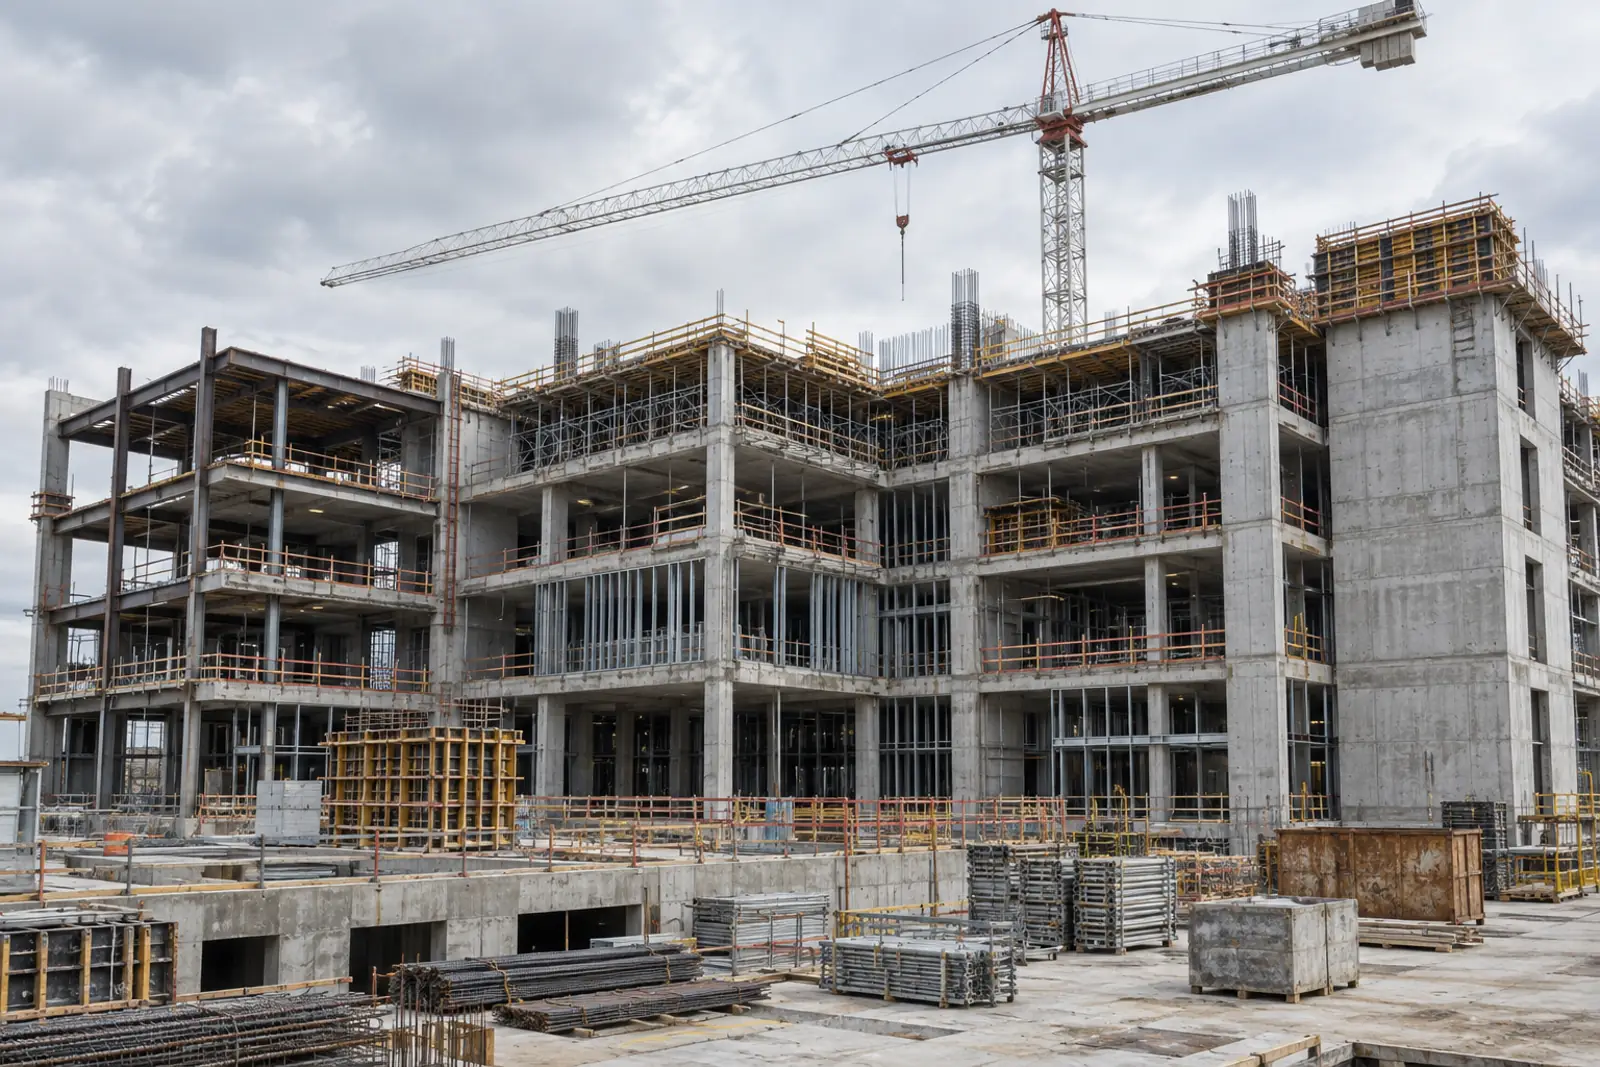
Federal agencies obligated $30.64 billion in FY2025 to commercial and institutional building contracts (NAICS 236220), down 0.7% from FY2024. Ranked as federal construction contracts by state, California led with $4.00 billion; per resident, Alaska led the states at $674.15. Defense buyers accounted for 56.2%, and the top 25 recipients received 38.2%.
Federal construction contracts by state: the FY2025 national total
Federal NAICS 236220 contract obligations were $30.64 billion in FY2025, nearly flat against FY2024, but the mix of buyers and places changed sharply.
Federal agencies obligated $30.64 billion to commercial and institutional building contracts in FY2025 (USAspending.gov). The FY2024 total was $30.85 billion, so the change was -0.7% in nominal dollars.
NAICS 236220: Commercial and Institutional Building Construction: new work, additions, alterations, maintenance and repairs of commercial and institutional buildings (U.S. Census Bureau). Federal records assign one NAICS code per contract, chosen by the contracting office.
Obligation: A binding promise by the government to spend money, now or later. An outlay is money actually paid. A deobligation cancels or reduces an earlier obligation (USAspending.gov glossary).
The 50 states and DC received $25.90 billion of the FY2025 total, equal to $75.76 per resident using Census Vintage 2025 population estimates. Work performed overseas or without a U.S. state code made up 10.7% of FY2025 obligations.
Place of performance; dollars per resident (Census Vintage 2025)
Source: USAspending.gov transaction download (accessed 2026-10-03); U.S. Census Bureau Vintage 2025 estimates. CB&C analysis.
NAICS 236220 was 3.9% of all FY2025 federal contract obligations of $778.54 billion (USAspending.gov). For private and public construction put in place nationally, see CB&C's commercial construction spending report.
State table: obligations, per-resident rank and change since FY2024
Totals are highest in California and Texas; per-resident values are highest in DC, Alaska and Hawaii. 32 of 51 jurisdictions fell from FY2024.
California had the largest FY2025 total at $4.00 billion, followed by Texas at $3.67 billion, Maryland at $1591.8 million, Florida at $1514.5 million and Arizona at $1489.0 million. These five places held 44.8% of domestic obligations.
50 states and DC, place of performance
Source: USAspending.gov transaction download, NAICS 236220, award types A to D (accessed 2026-10-03).
Per resident, DC ranked first at $706.0, Alaska second at $674.15 and Hawaii third at $649.51. South Dakota ($271.23) and Montana ($262.72) followed. Minnesota had the lowest value at $8.97 per resident.
Show all 57 rows
| Code | State | FY2025 obligations ($M) | Population July 1 2025 | FY2025 obligations per resident ($) | Per-resident rank | FY2024 obligations ($M) | Change FY2024 to FY2025 (%) |
|---|---|---|---|---|---|---|---|
| CA | California | 3999.1 | 39355309 | 101.62 | 17 | 2723.0 | 46.9 |
| TX | Texas | 3669.8 | 31709821 | 115.73 | 14 | 2158.6 | 70.0 |
| MD | Maryland | 1591.8 | 6265347 | 254.06 | 6 | 1904.8 | -16.4 |
| FL | Florida | 1514.5 | 23462518 | 64.55 | 23 | 1127.9 | 34.3 |
| AZ | Arizona | 1489.0 | 7623818 | 195.32 | 8 | 488.3 | 204.9 |
| GU | Guam | 1327.5 | n/a | n/a | n/a | 1269.6 | 4.6 |
| VA | Virginia | 996.9 | 8880107 | 112.26 | 16 | 1186.8 | -16.0 |
| HI | Hawaii | 930.6 | 1432820 | 649.51 | 3 | 1276.8 | -27.1 |
| WA | Washington | 904.8 | 8001020 | 113.09 | 15 | 952.6 | -5.0 |
| GA | Georgia | 867.7 | 11302748 | 76.77 | 20 | 722.8 | 20.0 |
| OK | Oklahoma | 774.1 | 4123288 | 187.74 | 9 | 468.3 | 65.3 |
| PA | Pennsylvania | 677.6 | 13059432 | 51.89 | 27 | 561.3 | 20.7 |
| NY | New York | 657.2 | 20002427 | 32.86 | 40 | 668.2 | -1.6 |
| AL | Alabama | 602.3 | 5193088 | 115.97 | 13 | 1068.3 | -43.6 |
| AK | Alaska | 497.0 | 737270 | 674.15 | 2 | 469.5 | 5.9 |
| DC | District of Columbia | 489.7 | 693645 | 706.0 | 1 | 1074.5 | -54.4 |
| NC | North Carolina | 489.5 | 11197968 | 43.72 | 29 | 767.5 | -36.2 |
| CO | Colorado | 415.8 | 6012561 | 69.15 | 22 | 388.7 | 7.0 |
| NV | Nevada | 398.6 | 3282188 | 121.45 | 10 | 249.9 | 59.5 |
| OH | Ohio | 307.4 | 11900510 | 25.83 | 43 | 431.0 | -28.7 |
| SC | South Carolina | 304.1 | 5570274 | 54.59 | 25 | 364.7 | -16.6 |
| MT | Montana | 300.7 | 1144694 | 262.72 | 5 | 236.6 | 27.1 |
| MS | Mississippi | 273.0 | 2954160 | 92.4 | 19 | 98.3 | 177.7 |
| TN | Tennessee | 270.0 | 7315076 | 36.91 | 33 | 265.9 | 1.5 |
| SD | South Dakota | 253.6 | 935094 | 271.23 | 4 | 502.0 | -49.5 |
| NM | New Mexico | 253.2 | 2125498 | 119.14 | 11 | 395.6 | -36.0 |
| MO | Missouri | 228.2 | 6270541 | 36.39 | 34 | 267.7 | -14.7 |
| KS | Kansas | 207.3 | 2977220 | 69.62 | 21 | 283.0 | -26.8 |
| MA | Massachusetts | 192.5 | 7154084 | 26.91 | 42 | 236.9 | -18.8 |
| MI | Michigan | 176.8 | 10127884 | 17.46 | 45 | 250.3 | -29.3 |
| UT | Utah | 175.7 | 3538904 | 49.63 | 28 | 198.8 | -11.6 |
| LA | Louisiana | 172.3 | 4618189 | 37.32 | 32 | 444.2 | -61.2 |
| IL | Illinois | 163.9 | 12719141 | 12.89 | 47 | 205.0 | -20.0 |
| KY | Kentucky | 145.2 | 4606864 | 31.52 | 41 | 206.0 | -29.5 |
| ME | Maine | 137.4 | 1414874 | 97.14 | 18 | 97.6 | 40.8 |
| PR | Puerto Rico | 134.6 | 3184835 | 42.27 | n/a | 529.5 | -74.6 |
| WY | Wyoming | 122.2 | 588753 | 207.48 | 7 | 240.7 | -49.3 |
| CT | Connecticut | 122.1 | 3688496 | 33.11 | 39 | 116.8 | 4.6 |
| AR | Arkansas | 121.6 | 3114791 | 39.03 | 30 | 226.4 | -46.3 |
| ID | Idaho | 118.9 | 2029733 | 58.59 | 24 | 166.7 | -28.6 |
| NJ | New Jersey | 118.5 | 9548215 | 12.41 | 48 | 160.3 | -26.1 |
| IA | Iowa | 117.1 | 3238387 | 36.17 | 35 | 90.7 | 29.1 |
| ND | North Dakota | 93.5 | 799358 | 117.01 | 12 | 254.3 | -63.2 |
| IN | Indiana | 73.1 | 6973333 | 10.48 | 49 | 201.9 | -63.8 |
| NE | Nebraska | 70.0 | 2018006 | 34.66 | 37 | 72.3 | -3.2 |
| OR | Oregon | 68.3 | 4273586 | 15.98 | 46 | 143.1 | -52.3 |
| WV | West Virginia | 67.3 | 1766147 | 38.1 | 31 | 187.9 | -64.2 |
| WI | Wisconsin | 61.6 | 5972787 | 10.31 | 50 | 139.4 | -55.8 |
| DE | Delaware | 57.6 | 1059952 | 54.3 | 26 | 49.1 | 17.2 |
| MN | Minnesota | 52.3 | 5830405 | 8.97 | 51 | 141.0 | -62.9 |
| NH | New Hampshire | 49.8 | 1415342 | 35.22 | 36 | 17.5 | 184.8 |
| RI | Rhode Island | 37.7 | 1114521 | 33.82 | 38 | 77.3 | -51.2 |
| VT | Vermont | 16.2 | 644663 | 25.07 | 44 | 3.4 | 371.6 |
| VI | Virgin Islands Of The U.S. | 6.4 | n/a | n/a | n/a | 2.5 | 153.2 |
| AS | American Samoa | 2.5 | n/a | n/a | n/a | 2.8 | -12.0 |
| AP | Armed Forces – Pacific | 2.3 | n/a | n/a | n/a | 0.0 | n/a |
| MP | Northern Mariana Islands | 1.8 | n/a | n/a | n/a | 0.3 | 486.0 |
Obligations in nominal $ millions, net of de-obligations. Per-resident values and ranks use Census Vintage 2025 July 1, 2025 estimates for the 50 states and DC; Puerto Rico shown with a value but not ranked; other territories have no Vintage 2025 estimate in the state file. AP = Armed Forces Pacific, as recorded.
Source: [1][8] U.S. Department of the Treasury, Bureau of the Fiscal Service (USAspending.gov); U.S. Census Bureau
Year over year, Arizona rose 204.9%, Texas 70.0% and California 46.9%. DC fell 54.4% and Puerto Rico fell 74.6%. Across the 50 states and DC combined, obligations rose 3.5% even though 32 jurisdictions declined.
$ millions, place of performance
Source: USAspending.gov transaction download (accessed 2026-10-03).
Place of performance is where the work happens, not where the contractor is based. For firm counts and locations, see commercial builders by state.
Who buys: agency mix of federal building contracts
Defense buyers still dominate, but their share fell to 56.2% as Customs and Border Protection obligated $5.11 billion.
Army Corps of Engineers offices obligated $6.61 billion in FY2025 (21.6%), down from $9.37 billion (30.4%) in FY2024. NAVFAC offices obligated $6.38 billion (20.8%).
Customs and Border Protection obligated $5.11 billion (16.7%) in FY2025, against $17.7 million in FY2024. Veterans Affairs obligated $2.81 billion (9.2%) and the Air Force $2.81 billion (9.2%). The GSA Public Buildings Service fell to $1.20 billion from $2.42 billion.
$ millions
Source: USAspending.gov transaction download; office grouping by CB&C (accessed 2026-10-03).
| Buying organization | FY2025 obligations ($M) | FY2025 share (%) | FY2024 obligations ($M) | FY2024 share (%) |
|---|---|---|---|---|
| USACE (Army Corps of Engineers offices) | 6614.2 | 21.6 | 9372.6 | 30.4 |
| NAVFAC (Naval Facilities Engineering Systems Command) | 6382.2 | 20.8 | 6823.6 | 22.1 |
| Customs and Border Protection (DHS) | 5106.3 | 16.7 | 17.7 | 0.1 |
| Veterans Affairs | 2810.0 | 9.2 | 2377.5 | 7.7 |
| Air Force | 2805.3 | 9.2 | 2826.8 | 9.2 |
| GSA Public Buildings Service | 1198.5 | 3.9 | 2423.6 | 7.9 |
| Army, other offices | 1177.0 | 3.8 | 1497.6 | 4.9 |
| State Department | 955.3 | 3.1 | 1207.1 | 3.9 |
| Other DHS (incl. Coast Guard) | 765.2 | 2.5 | 394.3 | 1.3 |
| Interior | 740.3 | 2.4 | 937.6 | 3.0 |
| Health and Human Services | 690.0 | 2.3 | 779.9 | 2.5 |
| Navy, other offices | 149.9 | 0.5 | 171.1 | 0.6 |
| Other Defense agencies | 84.2 | 0.3 | 111.1 | 0.4 |
| All other agencies | 1159.4 | 3.8 | 1913.9 | 6.2 |
USACE and NAVFAC are grouped from awarding office names in the transaction file; this grouping is CB&C's classification. Customs and Border Protection and the Coast Guard belong to DHS.
Source: [1] U.S. Department of the Treasury, Bureau of the Fiscal Service (USAspending.gov)
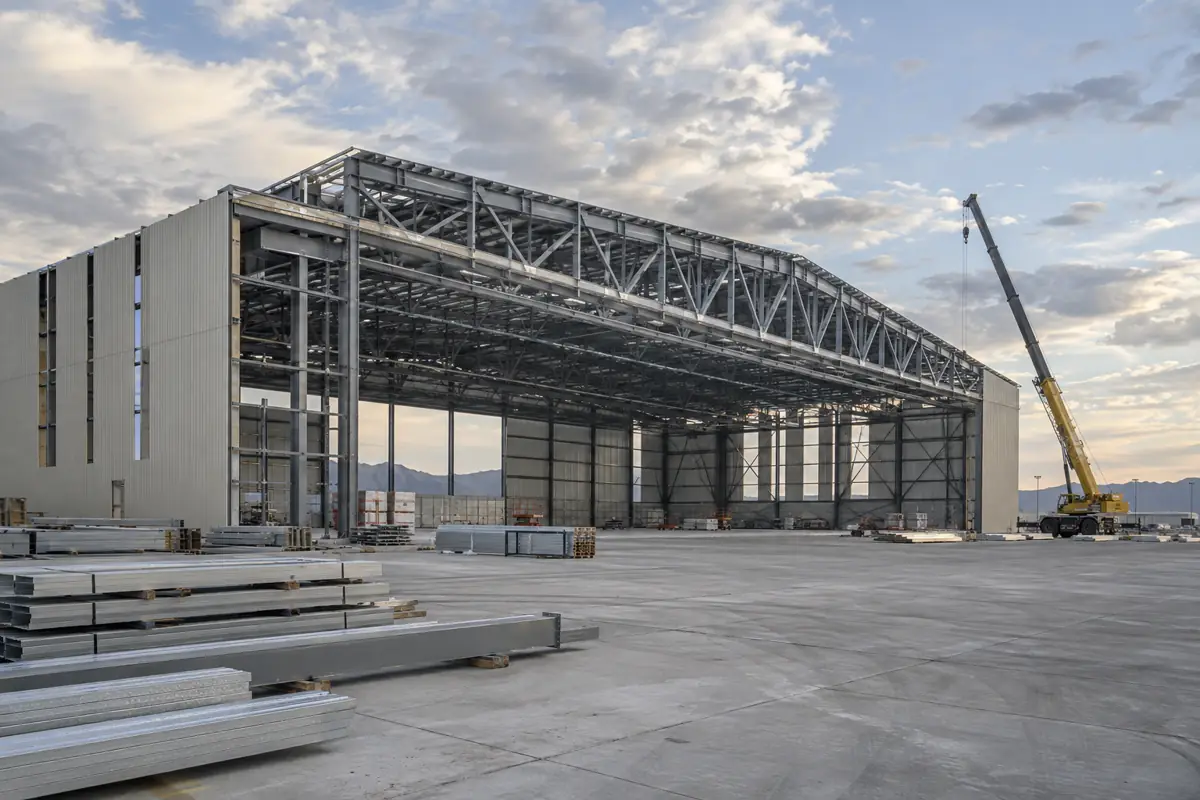
The CBP shift reflects border barrier work recorded under NAICS 236220. CBP said 10 Smart Wall construction contracts worth about $4.5 billion were awarded September 15 to 30, 2025, to add 230 miles of Smart Wall (CBP). NAICS 236220 is defined around buildings, but these border barrier contracts are coded to it in the federal record.
Registry: the 25 largest recipients of federal building contract obligations
3,664 recipients had FY2025 obligations, but the top 25 received 38.2%, more concentrated than in FY2024.
The top 10 recipients received $8.42 billion, 27.5% of FY2025 obligations, and the top 25 received $11.71 billion, 38.2% (USAspending.gov). In FY2024 the shares were 22.4% and 34.0%.
The three largest FY2025 recipients, BCCG A Joint Venture, Fisher Sand & Gravel Co and Barnard Spencer Joint Venture, received $4.83 billion together (15.8%), mainly from Customs and Border Protection. CBP's announced values for its seven BCCG projects sum to $3121.5 million, close to the $3127.1 million recorded for BCCG in FY2025.
Recipient names as recorded in federal award data
Source: USAspending.gov spending_by_category/recipient API (accessed 2026-10-03).
| Rank | Recipient (as recorded) | UEI | FY2025 obligations ($M) | Share of FY2025 total (%) | Cumulative share (%) | USAspending recipient page | Bulk-file check ($M) | Contract actions in FY2025 | First action date | Last action date | Largest awarding sub-agency | Largest place-of-performance state or country |
|---|---|---|---|---|---|---|---|---|---|---|---|---|
| 1 | BCCG A JOINT VENTURE | VNQTYNAV9C25 | 3127.1 | 10.21 | 10.2 | https://www.usaspending.gov/recipient/6a7d8bd5-7ff0-a23d-26fe-cef66843cff8-C/latest | 3127.1 | 9 | 2025-03-05 | 2025-09-26 | U.S. Customs and Border Protection | TX |
| 2 | FISHER SAND & GRAVEL CO | XAVBDA4D13N7 | 928.5 | 3.03 | 13.2 | https://www.usaspending.gov/recipient/fa0b2d2c-6660-adbe-e0ea-4035b15e4cbd-C/latest | 928.5 | 11 | 2025-01-30 | 2025-09-30 | U.S. Customs and Border Protection | CA |
| 3 | BARNARD SPENCER JOINT VENTURE | US79M57E8DT9 | 778.4 | 2.54 | 15.8 | https://www.usaspending.gov/recipient/eadbdb24-6a7b-473a-36b6-9e4d711f8825-C/latest | 778.4 | 2 | 2025-09-19 | 2025-09-19 | U.S. Customs and Border Protection | TX |
| 4 | BL HARBERT INTERNATIONAL LLC | XXNJCWMAKNH8 | 717.0 | 2.34 | 18.1 | https://www.usaspending.gov/recipient/f9896eaa-17af-6d01-f48f-cda50097f023-C/latest | 717.0 | 227 | 2024-10-17 | 2025-09-30 | Department of the Army | OK |
| 5 | WHITING-TURNER CONTRACTING COMPANY, THE | VEP4UN7LDMK5 | 604.9 | 1.97 | 20.1 | https://www.usaspending.gov/recipient/71cf1e91-51f2-f450-1fe3-3576b19bb828-C/latest | 604.9 | 228 | 2024-10-07 | 2025-09-30 | U.S. Coast Guard | WA |
| 6 | RQ CONSTRUCTION, LLC | NE61LN4FM1A5 | 601.1 | 1.96 | 22.1 | https://www.usaspending.gov/recipient/cfa69dd8-4b23-ff60-720d-4b32d819868b-C/latest | 601.1 | 111 | 2024-10-22 | 2025-09-30 | Department of the Navy | CA |
| 7 | CLARK CONSTRUCTION GROUP LLC | QQBXQR679KM9 | 492.3 | 1.61 | 23.7 | https://www.usaspending.gov/recipient/8470bfbc-50af-251d-d192-3059c5b82618-C/latest | 492.3 | 115 | 2024-10-16 | 2025-09-30 | Department of the Army | MD |
| 8 | BRASFIELD & GORRIE LLC | TWVGJRMK6Z78 | 441.4 | 1.44 | 25.1 | https://www.usaspending.gov/recipient/a4499a6f-2139-8774-afa2-247720ff681c-C/latest | 441.4 | 64 | 2024-10-29 | 2025-09-30 | Public Buildings Service | TX |
| 9 | HARPER CONSTRUCTION COMPANY, INC. | GMJPZCJDUG24 | 427.4 | 1.4 | 26.5 | https://www.usaspending.gov/recipient/bcc6c5bc-1af8-dd8c-f661-b7e35ae139bd-C/latest | 427.4 | 52 | 2024-11-06 | 2025-09-30 | Department of the Army | CA |
| 10 | WALSH FEDERAL LLC | DMFWBVTL9324 | 297.0 | 0.97 | 27.5 | https://www.usaspending.gov/recipient/05ed5d46-f203-4dc6-623a-3f47ed6933dd-C/latest | 297.0 | 140 | 2024-10-03 | 2025-09-30 | Federal Aviation Administration | ID |
| 11 | NAN INC | J1P1SQSCUYK6 | 289.4 | 0.94 | 28.4 | https://www.usaspending.gov/recipient/59a43f23-38e4-9f4d-cf6c-43d185e9419e-C/latest | 289.4 | 70 | 2024-11-07 | 2025-09-26 | Department of the Navy | HI |
| 12 | SAUER CONSTRUCTION, LLC | SBVUVJ2G3NL4 | 286.8 | 0.94 | 29.3 | https://www.usaspending.gov/recipient/c587380c-fe2b-292c-888b-4cd2249f856a-C/latest | 286.8 | 91 | 2024-10-11 | 2025-09-30 | Department of the Navy | FL |
| 13 | S. J. AMOROSO CONSTRUCTION CO., LLC | KU19CNLCK2K7 | 245.2 | 0.8 | 30.1 | https://www.usaspending.gov/recipient/6ff9cbd5-019e-8877-b1cb-d88b2789e0db-C/latest | 245.2 | 28 | 2024-10-29 | 2025-09-19 | Department of the Army | CA |
| 14 | ACC CONSTRUCTION CO., INC. | QXNSEJFDC1K3 | 223.6 | 0.73 | 30.9 | https://www.usaspending.gov/recipient/1eb42aa2-5383-c4a7-ee6b-53e6d23bbb2f-C/latest | 223.6 | 46 | 2024-11-15 | 2025-09-30 | Department of the Army | GA |
| 15 | CLARK CONSTRUCTION GROUP – CALIFORNIA, LP | WNJKMV59ZUL3 | 223.5 | 0.73 | 31.6 | https://www.usaspending.gov/recipient/619c649d-6647-e354-f2e2-5cd6d5d240ff-C/latest | 223.5 | 13 | 2025-01-30 | 2025-09-26 | Department of the Navy | CA |
| 16 | DPR-RQ CONSTRUCTION, LLC | ER3MFYYS2J86 | 222.6 | 0.73 | 32.3 | https://www.usaspending.gov/recipient/ea4259c9-0e65-6761-4a94-64538152cc87-C/latest | 222.6 | 10 | 2024-12-31 | 2025-09-30 | Department of the Navy | CA |
| 17 | CORE TECH-HDCC-KAJIMA LLC | H3PJV2J2DAA2 | 218.3 | 0.71 | 33.0 | https://www.usaspending.gov/recipient/29ccca1f-a79d-ba9c-0abd-5c3261dbdee3-C/latest | 218.3 | 23 | 2025-01-07 | 2025-09-26 | Department of the Navy | GU |
| 18 | CADDELL CONSTRUCTION CO. (DE), LLC | ELJMJND6DDF3 | 213.6 | 0.7 | 33.7 | https://www.usaspending.gov/recipient/1ee271cd-2103-5e4c-ba2d-a3386ac33049-C/latest | 213.6 | 88 | 2024-10-14 | 2025-09-30 | Department of State | ARGENTINA |
| 19 | J.E. DUNN CONSTRUCTION COMPANY | Y9FCAN97NHC9 | 206.7 | 0.67 | 34.4 | https://www.usaspending.gov/recipient/dce65e37-4d31-b857-7318-55ab31c49bcf-C/latest | 206.7 | 43 | 2024-10-02 | 2025-09-30 | Department of the Air Force | CO |
| 20 | J & J MAINTENANCE INC | Y4TKSMDNTRN6 | 201.6 | 0.66 | 35.1 | https://www.usaspending.gov/recipient/80d30511-4f48-088f-1c94-f7404764de80-C/latest | 201.6 | 165 | 2024-10-10 | 2025-09-30 | Department of the Army | HI |
| 21 | HURLEY JV, LLP | J1LWSNNJ6EY9 | 200.4 | 0.65 | 35.7 | https://www.usaspending.gov/recipient/08aad554-8971-5fd6-881b-ea493a0192f3-C/latest | 200.4 | 24 | 2024-10-17 | 2025-09-25 | Department of Veterans Affairs | KS |
| 22 | STRUCTSURE PROJECTS INC | F3K2LWVKFLX9 | 197.7 | 0.65 | 36.4 | https://www.usaspending.gov/recipient/80464fd4-c2d1-8e26-c32d-2a5bbbd73c15-C/latest | 197.7 | 67 | 2024-10-07 | 2025-09-29 | Department of the Army | OK |
| 23 | GRANITE-OBAYASHI 2, A JOINT VENTURE | CMP8GS8XJC51 | 195.3 | 0.64 | 37.0 | https://www.usaspending.gov/recipient/fc713b8d-73df-229a-3027-5fef61ede291-C/latest | 195.3 | 10 | 2024-11-19 | 2025-08-04 | Department of the Navy | GU |
| 24 | ARCHER WESTERN FEDERAL JV | C277DHXWNTU9 | 190.3 | 0.62 | 37.6 | https://www.usaspending.gov/recipient/4082fa5f-6dce-c865-5cca-b76bcfc2535b-C/latest | 190.3 | 72 | 2024-10-15 | 2025-09-29 | Department of the Army | MT |
| 25 | HENSEL PHELPS CONSTRUCTION CO | LA5LXK1PHJB5 | 184.8 | 0.6 | 38.2 | https://www.usaspending.gov/recipient/763e50aa-1cb8-d4ba-8295-da2833e5769c-C/latest | 184.8 | 39 | 2024-10-29 | 2025-09-29 | Department of the Army | HI |
Recipient names as recorded in federal award data. Amounts include new awards, modifications and de-obligations recorded in FY2025, including actions on awards made in earlier years. The bulk-file column re-sums the same recipient by UEI from the transaction download.
Source: [2][1][19] U.S. Department of the Treasury (USAspending.gov); U.S. Department of the Treasury, Bureau of the Fiscal Service (USAspending.gov); U.S. Department of the Treasury (USAspending.gov)
Revenue-based rankings such as BD+C rank firms by 2022 government building sector revenue; this registry measures FY2025 federal obligations only. For evaluating any bid, see how to compare construction bids.
Small-business share of federal building contract obligations
Contracting officers classified recipients as small on 44.0% of FY2025 obligations, down from FY2024; excluding CBP border barrier obligations, the share would be 52.7%.
Small businesses received $13.49 billion, or 44.0% of FY2025 NAICS 236220 obligations, based on the contracting officer's size determination. In FY2024 the share was 47.5% ($14.67 billion). Customs and Border Protection obligations went 99.3% to other-than-small recipients; excluding CBP, the FY2025 small-business share would be 52.7%.
Service-disabled veteran-owned small business set-asides carried $2390.2 million in FY2025, total small business set-asides $1955.1 million and 8(a) sole-source awards $1336.4 million. The set-aside field was blank on 55.3% of FY2025 obligations, mostly modifications, so these amounts are lower bounds.
| Measure | FY2025 ($M) | FY2025 share (%) | FY2024 ($M) | FY2024 share (%) |
|---|---|---|---|---|
| Small business (contracting officer size determination = S) | 13487.3 | 44.0 | 14666.9 | 47.5 |
| Other than small business (= O) | 17150.4 | 56.0 | 16187.6 | 52.5 |
| Set-aside type: (blank) | 16957.8 | 55.3 | 14286.0 | 46.3 |
| Set-aside type: NO SET ASIDE USED. | 7298.5 | 23.8 | 10123.5 | 32.8 |
| Set-aside type: SERVICE DISABLED VETERAN OWNED SMALL BUSINESS SET-ASIDE | 2390.2 | 7.8 | 2036.4 | 6.6 |
| Set-aside type: SMALL BUSINESS SET ASIDE – TOTAL | 1955.1 | 6.4 | 2329.2 | 7.5 |
| Set-aside type: 8(A) SOLE SOURCE | 1336.4 | 4.4 | 1445.4 | 4.7 |
| Set-aside type: 8A COMPETED | 291.6 | 1.0 | 335.3 | 1.1 |
| Set-aside type: HUBZONE SET-ASIDE | 211.2 | 0.7 | 118.1 | 0.4 |
| Set-aside type: SMALL BUSINESS SET ASIDE – PARTIAL | 61.4 | 0.2 | 8.2 | 0.0 |
| Set-aside type: WOMEN OWNED SMALL BUSINESS | 54.2 | 0.2 | 67.0 | 0.2 |
| Set-aside type: SDVOSB SOLE SOURCE | 30.3 | 0.1 | 36.5 | 0.1 |
| Set-aside type: INDIAN SMALL BUSINESS ECONOMIC ENTERPRISE | 25.6 | 0.1 | 45.8 | 0.1 |
| Set-aside type: HUBZONE SOLE SOURCE | 12.9 | 0.0 | 6.2 | 0.0 |
| Set-aside type: WOMEN OWNED SMALL BUSINESS SOLE SOURCE | 5.3 | 0.0 | 10.2 | 0.0 |
| Set-aside type: ECONOMICALLY DISADVANTAGED WOMEN OWNED SMALL BUSINESS | 3.3 | 0.0 | 0.6 | 0.0 |
| Set-aside type: VETERAN SET ASIDE | 2.9 | 0.0 | 3.3 | 0.0 |
| Set-aside type: BUY INDIAN | 0.9 | 0.0 | 0.0 | 0.0 |
| Set-aside type: ECONOMICALLY DISADVANTAGED WOMEN OWNED SMALL BUSINESS SOLE SOURCE | 0.1 | 0.0 | 1.2 | 0.0 |
| Set-aside type: INDIAN ECONOMIC ENTERPRISE | 0.0 | 0.0 | 1.5 | 0.0 |
Business size uses the contracting officer's size determination on each transaction. The set-aside field is blank on many modification transactions, so set-aside rows understate set-aside dollars.
Source: [1][11] U.S. Department of the Treasury, Bureau of the Fiscal Service (USAspending.gov); General Services Administration (Acquisition.gov)
Small business set-aside: Under FAR 19.502-2, contracting officers set aside acquisitions above the simplified acquisition threshold when at least two responsible small businesses are expected to offer at fair market prices. The SBA size standard for NAICS 236220 is $45.0 million in average annual receipts (13 CFR 121.201).
For context, SBA reported that small businesses received nearly 28% of all federal prime contract dollars in FY2025, $179 billion, against a 23% statutory goal (SBA). The SBA scorecard uses its own exclusions, so it is not directly comparable to the NAICS 236220 share.
FY2026 preliminary: what the incomplete year shows so far
Reported FY2026 obligations already exceed FY2025, driven by CBP, but Defense data for the last quarter has not posted.
As of October 3, 2026, USAspending.gov shows $52.16 billion in FY2026 NAICS 236220 obligations, of which $29.16 billion (55.9%) came from Customs and Border Protection (USAspending.gov).
Defense and Army Corps of Engineers procurement records post on a 90-day delay (USAspending.gov About the Data). Defense obligations reported for July to September FY2026 total $117.6 million, against $9.98 billion for those months in FY2025. September alone held 44.9% of FY2025 obligations, so FY2026 figures will change.
| Awarding sub-agency | FY2025 obligations ($M) | FY2026 preliminary obligations ($M) |
|---|---|---|
| U.S. Customs and Border Protection | 5106.3 | 29164.3 |
| Department of the Army | 7791.2 | 5099.4 |
| Department of the Navy | 6532.0 | 4163.2 |
| Department of Veterans Affairs | 2810.0 | 3530.5 |
| U.S. Coast Guard | 634.1 | 2478.5 |
| Public Buildings Service | 1198.5 | 2149.3 |
| Department of the Air Force | 2805.3 | 1163.5 |
| All agencies | 30637.7 | 52164.5 |
FY2026 values as reported on 2026-10-03 and incomplete: DoD and USACE records post on a 90-day delay. Do not compare FY2026 Defense values with FY2025.
Source: [5][4][7] U.S. Department of the Treasury (USAspending.gov); U.S. Department of the Treasury (USAspending.gov); U.S. Department of the Treasury (USAspending.gov)
FY2025 versus FY2026 as reported on 2026-10-03
Source: USAspending.gov spending_over_time API; About the Data (90-day DoD delay). Accessed 2026-10-03.
| Fiscal month | DoD FY2025 obligations ($M) | DoD FY2026 obligations reported as of 2026-10-03 ($M) |
|---|---|---|
| Oct | 377.7 | 165.4 |
| Nov | 420.6 | 712.3 |
| Dec | 863.3 | 1163.0 |
| Jan | 589.7 | 856.3 |
| Feb | 841.9 | 1451.5 |
| Mar | 947.5 | 1862.2 |
| Apr | 1082.2 | 1211.7 |
| May | 949.4 | 1286.8 |
| Jun | 1163.9 | 1632.7 |
| Jul | 2381.5 | 117.4 |
| Aug | 1626.1 | 0.3 |
| Sep | 5968.9 | 0.0 |
The near-zero values for July to September FY2026 reflect the 90-day publication delay, not a halt in spending.
Source: [4][7] U.S. Department of the Treasury (USAspending.gov); U.S. Department of the Treasury (USAspending.gov)
Registry of recorded awards
Checked Quarterly, and again in early January 2027 when Defense FY2026 records have posted after the 90-day delay. Last checked 2026-10-03. Entries are neutral records of public data; each links to its source record.
| Recipient | Recorded obligations | Date | Evidence | Source |
|---|---|---|---|---|
| BCCG A JOINT VENTURE | $3127.1 million in net contract obligations recorded in FY2025 federal award data (9 transactions, first 2025-03-05, last 2025-09-26); largest buyer: U.S. Customs and Border Protection; largest place of performance: TX | 2025-09-26 | federal award record | Record |
| FISHER SAND & GRAVEL CO | $928.5 million in net contract obligations recorded in FY2025 federal award data (11 transactions, first 2025-01-30, last 2025-09-30); largest buyer: U.S. Customs and Border Protection; largest place of performance: CA | 2025-09-30 | federal award record | Record |
| BARNARD SPENCER JOINT VENTURE | $778.4 million in net contract obligations recorded in FY2025 federal award data (2 transactions, first 2025-09-19, last 2025-09-19); largest buyer: U.S. Customs and Border Protection; largest place of performance: TX | 2025-09-19 | federal award record | Record |
| BL HARBERT INTERNATIONAL LLC | $717.0 million in net contract obligations recorded in FY2025 federal award data (227 transactions, first 2024-10-17, last 2025-09-30); largest buyer: Department of the Army; largest place of performance: OK | 2025-09-30 | federal award record | Record |
| WHITING-TURNER CONTRACTING COMPANY, THE | $604.9 million in net contract obligations recorded in FY2025 federal award data (228 transactions, first 2024-10-07, last 2025-09-30); largest buyer: U.S. Coast Guard; largest place of performance: WA | 2025-09-30 | federal award record | Record |
| RQ CONSTRUCTION, LLC | $601.1 million in net contract obligations recorded in FY2025 federal award data (111 transactions, first 2024-10-22, last 2025-09-30); largest buyer: Department of the Navy; largest place of performance: CA | 2025-09-30 | federal award record | Record |
| CLARK CONSTRUCTION GROUP LLC | $492.3 million in net contract obligations recorded in FY2025 federal award data (115 transactions, first 2024-10-16, last 2025-09-30); largest buyer: Department of the Army; largest place of performance: MD | 2025-09-30 | federal award record | Record |
| BRASFIELD & GORRIE LLC | $441.4 million in net contract obligations recorded in FY2025 federal award data (64 transactions, first 2024-10-29, last 2025-09-30); largest buyer: Public Buildings Service; largest place of performance: TX | 2025-09-30 | federal award record | Record |
| HARPER CONSTRUCTION COMPANY, INC. | $427.4 million in net contract obligations recorded in FY2025 federal award data (52 transactions, first 2024-11-06, last 2025-09-30); largest buyer: Department of the Army; largest place of performance: CA | 2025-09-30 | federal award record | Record |
| WALSH FEDERAL LLC | $297.0 million in net contract obligations recorded in FY2025 federal award data (140 transactions, first 2024-10-03, last 2025-09-30); largest buyer: Federal Aviation Administration; largest place of performance: ID | 2025-09-30 | federal award record | Record |
| NAN INC | $289.4 million in net contract obligations recorded in FY2025 federal award data (70 transactions, first 2024-11-07, last 2025-09-26); largest buyer: Department of the Navy; largest place of performance: HI | 2025-09-26 | federal award record | Record |
| SAUER CONSTRUCTION, LLC | $286.8 million in net contract obligations recorded in FY2025 federal award data (91 transactions, first 2024-10-11, last 2025-09-30); largest buyer: Department of the Navy; largest place of performance: FL | 2025-09-30 | federal award record | Record |
| S. J. AMOROSO CONSTRUCTION CO., LLC | $245.2 million in net contract obligations recorded in FY2025 federal award data (28 transactions, first 2024-10-29, last 2025-09-19); largest buyer: Department of the Army; largest place of performance: CA | 2025-09-19 | federal award record | Record |
| ACC CONSTRUCTION CO., INC. | $223.6 million in net contract obligations recorded in FY2025 federal award data (46 transactions, first 2024-11-15, last 2025-09-30); largest buyer: Department of the Army; largest place of performance: GA | 2025-09-30 | federal award record | Record |
| CLARK CONSTRUCTION GROUP – CALIFORNIA, LP | $223.5 million in net contract obligations recorded in FY2025 federal award data (13 transactions, first 2025-01-30, last 2025-09-26); largest buyer: Department of the Navy; largest place of performance: CA | 2025-09-26 | federal award record | Record |
| DPR-RQ CONSTRUCTION, LLC | $222.6 million in net contract obligations recorded in FY2025 federal award data (10 transactions, first 2024-12-31, last 2025-09-30); largest buyer: Department of the Navy; largest place of performance: CA | 2025-09-30 | federal award record | Record |
| CORE TECH-HDCC-KAJIMA LLC | $218.3 million in net contract obligations recorded in FY2025 federal award data (23 transactions, first 2025-01-07, last 2025-09-26); largest buyer: Department of the Navy; largest place of performance: GU | 2025-09-26 | federal award record | Record |
| CADDELL CONSTRUCTION CO. (DE), LLC | $213.6 million in net contract obligations recorded in FY2025 federal award data (88 transactions, first 2024-10-14, last 2025-09-30); largest buyer: Department of State; largest place of performance: ARGENTINA | 2025-09-30 | federal award record | Record |
| J.E. DUNN CONSTRUCTION COMPANY | $206.7 million in net contract obligations recorded in FY2025 federal award data (43 transactions, first 2024-10-02, last 2025-09-30); largest buyer: Department of the Air Force; largest place of performance: CO | 2025-09-30 | federal award record | Record |
| J & J MAINTENANCE INC | $201.6 million in net contract obligations recorded in FY2025 federal award data (165 transactions, first 2024-10-10, last 2025-09-30); largest buyer: Department of the Army; largest place of performance: HI | 2025-09-30 | federal award record | Record |
| HURLEY JV, LLP | $200.4 million in net contract obligations recorded in FY2025 federal award data (24 transactions, first 2024-10-17, last 2025-09-25); largest buyer: Department of Veterans Affairs; largest place of performance: KS | 2025-09-25 | federal award record | Record |
| STRUCTSURE PROJECTS INC | $197.7 million in net contract obligations recorded in FY2025 federal award data (67 transactions, first 2024-10-07, last 2025-09-29); largest buyer: Department of the Army; largest place of performance: OK | 2025-09-29 | federal award record | Record |
| GRANITE-OBAYASHI 2, A JOINT VENTURE | $195.3 million in net contract obligations recorded in FY2025 federal award data (10 transactions, first 2024-11-19, last 2025-08-04); largest buyer: Department of the Navy; largest place of performance: GU | 2025-08-04 | federal award record | Record |
| ARCHER WESTERN FEDERAL JV | $190.3 million in net contract obligations recorded in FY2025 federal award data (72 transactions, first 2024-10-15, last 2025-09-29); largest buyer: Department of the Army; largest place of performance: MT | 2025-09-29 | federal award record | Record |
| HENSEL PHELPS CONSTRUCTION CO | $184.8 million in net contract obligations recorded in FY2025 federal award data (39 transactions, first 2024-10-29, last 2025-09-29); largest buyer: Department of the Army; largest place of performance: HI | 2025-09-29 | federal award record | Record |
State-by-state findings
- Federal NAICS 236220 contract obligations totaled $30.64 billion in FY2025 across all places of performance.[1]
- FY2025 obligations were 0.7% lower than FY2024 ($30.85 billion), in nominal dollars.[1]
- NAICS 236220 accounted for 3.9% of all FY2025 federal contract obligations ($778.54 billion).[1][4]
- The 50 states and DC received $25.90 billion in FY2025, or $75.76 per resident using July 1, 2025 Census estimates.[1][8]
- Alaska had the highest per-resident value among the 50 states in FY2025 at $674.15; Minnesota had the lowest at $8.97.[1][8]
- California recorded $4.00 billion in FY2025 place-of-performance obligations, the highest state total, up 46.9% from FY2024.[1]
- Arizona obligations rose 204.9% from FY2024 to FY2025, to $1489.0 million; Texas rose 70.0%.[1]
- 32 of the 50 states and DC recorded lower obligations in FY2025 than in FY2024; 19 recorded higher obligations.[1]
- Guam, a territory, recorded $1.33 billion in FY2025, more than any state except California, Texas, Maryland, Florida and Arizona.[1]
- Defense buyers accounted for 56.2% ($17.21 billion) of FY2025 obligations, versus 67.4% in FY2024.[1]
- Customs and Border Protection obligated $5.11 billion (16.7%) in FY2025, up from 0.1% of FY2024.[1]
- The 25 largest recipients received $11.71 billion, 38.2% of FY2025 obligations; 3,664 recipients had FY2025 obligations.[2]
- BCCG A Joint Venture had the largest FY2025 total at $3.13 billion (10.21% of all obligations), mainly from Customs and Border Protection.[2][16]
- Small businesses, as determined by contracting officers, received $13.49 billion or 44.0% of FY2025 obligations.[1]
- FY2025 contained 2,481 negative transactions (de-obligations) summing to $-1280.1 million, already netted in the totals.[1][6]
Rankings and ratios we derived
Obligations per resident by state (FY2025)
Formulastate FY2025 obligations / July 1, 2025 resident population
Inputs: fact sheet state obligation rows (s1) and population rows (s8); derived rows pc_* (fact sheet rows)
Result: Range $8.97 (Minnesota) to $706.0 (DC); 50-state and DC average $75.76
The highest values occur where large federal projects are performed in places with small populations, such as DC, Alaska and Hawaii.
Limitations: Place of performance only; one large award can move a small state. Territories other than Puerto Rico lack Vintage 2025 estimates.
Recipient concentration
Formulasum of top N recipient obligations / total obligations
Inputs: recipient rows (s2), total row (s1) (fact sheet rows)
Result: Top 10: 27.5% (FY2024 22.4%); top 25: 38.2% (FY2024 34.0%)
Concentration rose in FY2025; the three largest recipients, all mainly CBP border barrier contractors, took 15.8%.
Limitations: Recipient profiles, not parent companies; joint ventures counted separately.
Agency mix
Formulabuying organization obligations / total obligations
Inputs: agency rows (s1) (fact sheet rows)
Result: USACE 21.6%, NAVFAC 20.8%, CBP 16.7%, VA 9.2%, GSA PBS 3.9%; Defense total 56.2%
Defense buyers lost share to CBP between FY2024 and FY2025.
Limitations: USACE and NAVFAC grouped by awarding office name; USACE also contracts on behalf of other agencies.
Year-over-year change by state
Formula(FY2025 - FY2024) / FY2024 x 100
Inputs: state FY2025 and FY2024 rows (s1) (fact sheet rows)
Result: 19 up, 32 down; 50 states and DC combined 3.5%
The largest dollar gains were in Texas, California and Arizona; declines were spread across most other jurisdictions.
Limitations: Nominal dollars; small bases swing sharply.
Small-business share
Formulaobligations with contracting officer size determination S / total
Inputs: small business rows (s1) (fact sheet rows)
Result: 44.0% in FY2025, 47.5% in FY2024
CBP obligations went 99.3% to other-than-small recipients; excluding CBP, the FY2025 small-business share would be 52.7%.
Limitations: Size is determined per contract action and can differ from a firm's current SBA status.
Executive summary
- Federal agencies obligated $30.64 billion to NAICS 236220 contracts in FY2025, compared with $30.85 billion in FY2024, a change of -0.7% (USAspending.gov).
- Across the 50 states and DC, FY2025 obligations equaled $75.76 per resident; DC ($706.0), Alaska ($674.15) and Hawaii ($649.51) had the highest per-resident values.
- California ($4.00 billion) and Texas ($3.67 billion) had the largest totals; the five largest places of performance held 44.8% of domestic obligations.
- Defense buyers accounted for 56.2% of FY2025 obligations, down from 67.4% in FY2024, as Customs and Border Protection rose to 16.7%.
- The Army Corps of Engineers offices obligated $6.61 billion (21.6%) and NAVFAC $6.38 billion (20.8%).
- The top 10 recipients received 27.5% and the top 25 received 38.2% of FY2025 obligations, up from 22.4% and 34.0% in FY2024.
- Contracting officers classified recipients as small businesses on 44.0% of FY2025 obligations, down from 47.5% in FY2024.
- Preliminary FY2026 records already show $52.16 billion as of October 3, 2026, with $29.16 billion from Customs and Border Protection, before most Defense data for July to September has posted.
Questions people ask
Which state gets the most federal construction money?
California, with $4.00 billion in FY2025 NAICS 236220 contract obligations by place of performance, followed by Texas at $3.67 billion (USAspending.gov). Per resident, Alaska leads the 50 states at $674.15, and DC is higher at $706.0.
Who are the largest federal construction contractors?
By FY2025 NAICS 236220 obligations, the largest recipients were BCCG A Joint Venture ($3127.1 million), Fisher Sand & Gravel Co ($928.5 million), Barnard Spencer Joint Venture ($778.4 million), BL Harbert International ($717.0 million) and Whiting-Turner Contracting ($604.9 million). The full top 25 is in the registry.
How much does the US Army Corps of Engineers spend on construction contracts?
Army Corps of Engineers offices obligated $6.61 billion on NAICS 236220 contracts in FY2025, 21.6% of the total, down from $9.37 billion in FY2024. This excludes Corps work coded to other industries, such as heavy and civil engineering.
What percentage of federal construction contracts go to small businesses?
In FY2025, 44.0% of NAICS 236220 contract obligations ($13.49 billion) went to recipients that contracting officers classified as small, down from 47.5% in FY2024.
How do I find federal construction contracts in my state?
Contracting officers publish notices of proposed contract actions to the Governmentwide Point of Entry, which is SAM.gov (FAR 5.201). Past awards can be filtered by place-of-performance state and NAICS 236220 on USAspending.gov. Construction notices state a price range, from less than $25,000 to more than $10,000,000 (FAR 36.204).
Download the data
Every table in this report is available as a CSV under CC BY 4.0. The fact sheet lists each value with its source URL and access date.
- derived_metrics.csv (CSV)
- fact_sheet.csv (CSV)
- t1_states.csv (CSV)
- t2_agency_mix.csv (CSV)
- t3_top25_recipients.csv (CSV)
- t4_small_business.csv (CSV)
- t5_fy2026_preliminary.csv (CSV)
- t6_dod_monthly_reporting.csv (CSV)
For journalists and researchers
If you cite only a few, cite these
- Federal agencies obligated $30.64 billion to commercial and institutional building contracts (NAICS 236220) in FY2025.[1]
- Alaska received $674.15 per resident in FY2025 federal building contract obligations, the most of any state; the national average was $75.76.[1][8]
- The 25 largest recipients received 38.2% of FY2025 federal building contract obligations, up from 34.0% in FY2024.[2]
Most quotable statistics
- Federal agencies obligated $30.64 billion to commercial and institutional building contracts (NAICS 236220) in FY2025.[1]
- Alaska received $674.15 per resident in FY2025 federal building contract obligations, the most of any state; the national average was $75.76.[1][8]
- Customs and Border Protection's share of federal building contract obligations rose from 0.1% in FY2024 to 16.7% in FY2025.[1]
- The 25 largest recipients received 38.2% of FY2025 federal building contract obligations, up from 34.0% in FY2024.[2]
- Small businesses received 44.0% of FY2025 federal building contract obligations, down from 47.5% in FY2024.[1]
- Army Corps of Engineers offices obligated $6.61 billion in FY2025 building contracts, down from $9.37 billion in FY2024.[1]
Press summary
Federal agencies obligated $30.64 billion to commercial and institutional building contracts in FY2025, according to a CB&C analysis of USAspending.gov transaction records for NAICS 236220, compared with $30.85 billion in FY2024. California had the largest state total at $4.00 billion, while Alaska led the states per resident at $674.15, against a national average of $75.76. The buyer mix shifted: Defense agencies accounted for 56.2% of obligations, down from 67.4%, as Customs and Border Protection rose to 16.7% on border barrier contracts. The 25 largest recipients received 38.2% of the total, and small businesses received 44.0%. Preliminary FY2026 data already shows $52.16 billion, but Defense records post on a 90-day delay, so that figure will change. The analysis ranks every state per resident and lists the 25 largest recipients with links to their federal records.
Suggested headlines
- Federal building contract obligations hold at $30.64 billion in FY2025
- Alaska tops states with $674.15 per resident in federal building contracts
- Border barrier work lifts CBP to 16.7% of federal building contract dollars
- Top 25 recipients take 38.2% of federal building contract obligations
- Small-business share of federal building contracts slips to 44.0%
How to cite this report
Commercial Builders & Contractors. (2026). Federal Construction Contracts by State: FY2025 Obligations, Buyers and Top Recipients. Retrieved from https://commercialbuildersandcontractors.com/federal-construction-contracts-by-state/
Reuse license
Data and tables are licensed CC BY 4.0. Attribution: “Source: Commercial Builders & Contractors, Federal Construction Contracts by State: FY2025 Obligations, Buyers and Top Recipients” with a link to this page.
Frequently asked questions
How much did the federal government spend on building construction contracts in FY2025?
Agencies obligated $30.64 billion under NAICS 236220 in FY2025 (October 1, 2024 to September 30, 2025), according to USAspending.gov transaction data. Obligations are commitments, not payments.
Did federal building contract obligations rise or fall in FY2025?
They changed -0.7%, from $30.85 billion in FY2024 to $30.64 billion in FY2025, in nominal dollars.
Which state has the most federal construction contract dollars per resident?
Among the 50 states, Alaska at $674.15 per resident in FY2025, followed by Hawaii at $649.51. DC is higher at $706.0.
Which state has the least per resident?
Minnesota, at $8.97 per resident in FY2025, followed by Wisconsin at $10.31 and Indiana at $10.48.
Which agency buys the most federal building construction?
The Department of Defense, at 56.2% of FY2025 obligations. Within Defense, Army Corps of Engineers offices obligated $6.61 billion and NAVFAC $6.38 billion.
Why did Customs and Border Protection become a large buyer?
CBP obligated $5.11 billion under NAICS 236220 in FY2025, mostly for border barrier contracts; CBP announced 10 Smart Wall contracts worth about $4.5 billion awarded in September 2025.
How concentrated are federal building contract dollars?
The top 25 of 3,664 recipients received 38.2% of FY2025 obligations, and the top 10 received 27.5%.
Can obligation amounts be negative?
Yes. FY2025 had 2,481 negative transactions totaling $-1280.1 million, recording de-obligations that reduce earlier commitments.
Is FY2026 data available?
Partly. $52.16 billion was reported as of October 3, 2026, but Defense and Corps records post on a 90-day delay, so FY2026 is preliminary.
What is the small business size standard for commercial building construction?
$45.0 million in average annual receipts for NAICS 236220, under 13 CFR 121.201.
Methodology
Scope: all federal prime contract transactions (award types A to D: A for BPA calls, B for purchase orders, C for delivery orders and D for standalone contract awards) coded NAICS 236220 with an action date in FY2025 (2024-10-01 to 2025-09-30) or FY2024, downloaded from the USAspending.gov API on 2026-10-03. Totals sum the federal action obligation on every base award and modification, so de-obligations are netted. Totals from the download match the USAspending spending_over_time and spending_by_geography endpoints.
Selection: Tier 1 sources only for every figure (USAspending.gov, Census Bureau, FAR, eCFR, SBA, CBP, GAO). Tier 3 pages are used only to compare scope with existing pages. Market research estimates were not used. Industry is the NAICS code chosen by the contracting office per award; work coded to other construction industries (for example heavy and civil engineering) is excluded.
Geography: place-of-performance state on each transaction. Per-resident values divide FY2025 obligations by Census Vintage 2025 July 1, 2025 resident population (released 2026-01-27). Puerto Rico is shown but not ranked; other territories have no estimate in that file. GAO found place-of-performance addresses improperly reported in at least 10% of sampled transactions in its 2019 review, so state values carry some reporting error.
Agency mix: awarding agency and sub-agency as recorded. USACE and NAVFAC are CB&C groupings of Army and Navy awarding offices by office name (ENDIST, ENDIV, ENG SPT CTR; NAVFAC). Recipient rankings use USAspending recipient profiles from the spending_by_category/recipient endpoint and were cross-checked by UEI against the transaction file; all 25 matched to the $0.1 million.
Small business: the contracting officer's size determination (S or O) on each transaction. Set-aside dollars use the type-of-set-aside field, which is blank on many modifications. Conflicts: the API business-category filter gives a slightly different small-business sum than the size determination; this report uses the size determination field.
Latest release check: FY2026 ended on 2026-09-30, but Defense and Corps procurement records post on a 90-day delay, and Defense July to September FY2026 records were nearly absent on 2026-10-03. FY2025 is therefore used as the latest complete year and FY2026 is reported as preliminary only. Registry checked 2026-10-03; it will be re-checked quarterly and in early January 2027.
All values are nominal dollars. Nothing in this report is legal, financial or bidding advice. Data and tables may be reused under the Creative Commons Attribution (CC BY) license stated in the page reuse notice, with attribution to Commercial Builders & Contractors (CB&C). Last updated 2026-10-03.
This report presents published data with its limitations. It is not legal, financial or investment advice.
Sources, ranked by quality
Tier 1: primary and official sources (19)
- [1] U.S. Department of the Treasury, Bureau of the Fiscal Service (USAspending.gov). USAspending.gov custom prime transaction download, NAICS 236220, award types A to D (endpoint documentation; data queried 2026-10-03). FY2024 and FY2025. Accessed 2026-10-03.
- [2] U.S. Department of the Treasury (USAspending.gov). USAspending.gov API, spending_by_category/recipient (endpoint documentation; data queried 2026-10-03). FY2024 and FY2025. Accessed 2026-10-03.
- [3] U.S. Department of the Treasury (USAspending.gov). USAspending.gov API, spending_by_geography (place of performance) (endpoint documentation; data queried 2026-10-03). FY2024 to FY2026. Accessed 2026-10-03.
- [4] U.S. Department of the Treasury (USAspending.gov). USAspending.gov API, spending_over_time (endpoint documentation; data queried 2026-10-03). FY2024 to FY2026 (FY2026 preliminary). Accessed 2026-10-03.
- [5] U.S. Department of the Treasury (USAspending.gov). USAspending.gov API, spending_by_category/awarding_subagency (endpoint documentation; data queried 2026-10-03). FY2025 and FY2026 (preliminary). Accessed 2026-10-03.
- [6] U.S. Department of the Treasury (USAspending.gov). USAspending.gov glossary (Obligation, Outlay, Deobligation, Primary Place of Performance, Set Aside Type). current. Accessed 2026-10-03.
- [7] U.S. Department of the Treasury (USAspending.gov). About the Data (last updated November 19, 2025): Delay in Department of Defense Procurement Data. last updated 2025-11-19. Accessed 2026-10-03.
- [8] U.S. Census Bureau. Annual Estimates of the Resident Population for the United States, Regions, States, DC and Puerto Rico (NST-EST2025-ALLDATA). July 1, 2025 (Vintage 2025). Accessed 2026-10-03.
- [9] U.S. Census Bureau. Vintage 2025 National and State Population Estimates (press kit, January 27, 2026). released 2026-01-27. Accessed 2026-10-03.
- [10] U.S. Census Bureau. NAICS 236220 Commercial and Institutional Building Construction (2022 NAICS). 2022 NAICS. Accessed 2026-10-03.
- [11] General Services Administration (Acquisition.gov). FAR 19.502-2 Total small business set-asides. current FAR. Accessed 2026-10-03.
- [12] General Services Administration (Acquisition.gov). FAR 5.201 General (publicizing proposed contract actions through the GPE). current FAR. Accessed 2026-10-03.
- [13] General Services Administration (Acquisition.gov). FAR 36.204 Disclosure of the magnitude of construction projects. current FAR. Accessed 2026-10-03.
- [14] Electronic Code of Federal Regulations (eCFR). 13 CFR 121.201 Small business size standards by NAICS industry. current eCFR. Accessed 2026-10-03.
- [15] U.S. Small Business Administration. SBA Releases FY25 Scorecard for Small Business Contracting (June 25, 2026). FY2025 (released 2026-06-25). Accessed 2026-10-03.
- [16] U.S. Customs and Border Protection. DHS, CBP award $4.5B in new contracts under OBBB for Smart Wall construction along southwest border (October 10, 2025). September 2025 (released 2025-10-10). Accessed 2026-10-03.
- [17] U.S. Government Accountability Office. The DATA Act: Checking in on Spending Transparency (WatchBlog, on report GAO-20-75). 2019 (GAO-20-75). Accessed 2026-10-03.
- [18] General Services Administration (SAM.gov). Contracting (SAM.gov). current. Accessed 2026-10-03.
- [19] U.S. Department of the Treasury (USAspending.gov). USAspending.gov recipient profiles (one page per registry entry; links in the registry). FY2025. Accessed 2026-10-03.
Tier 3: journalism and expert commentary (2)
- [20] Federal Schedules, Inc.. Which States Capture the Largest Share of Federal Contracts? (FY2025). FY2025. Accessed 2026-10-03.
- [21] Building Design+Construction (BD+C). Top 100 Government Building Construction Firms for 2023. 2022 revenue. Accessed 2026-10-03.