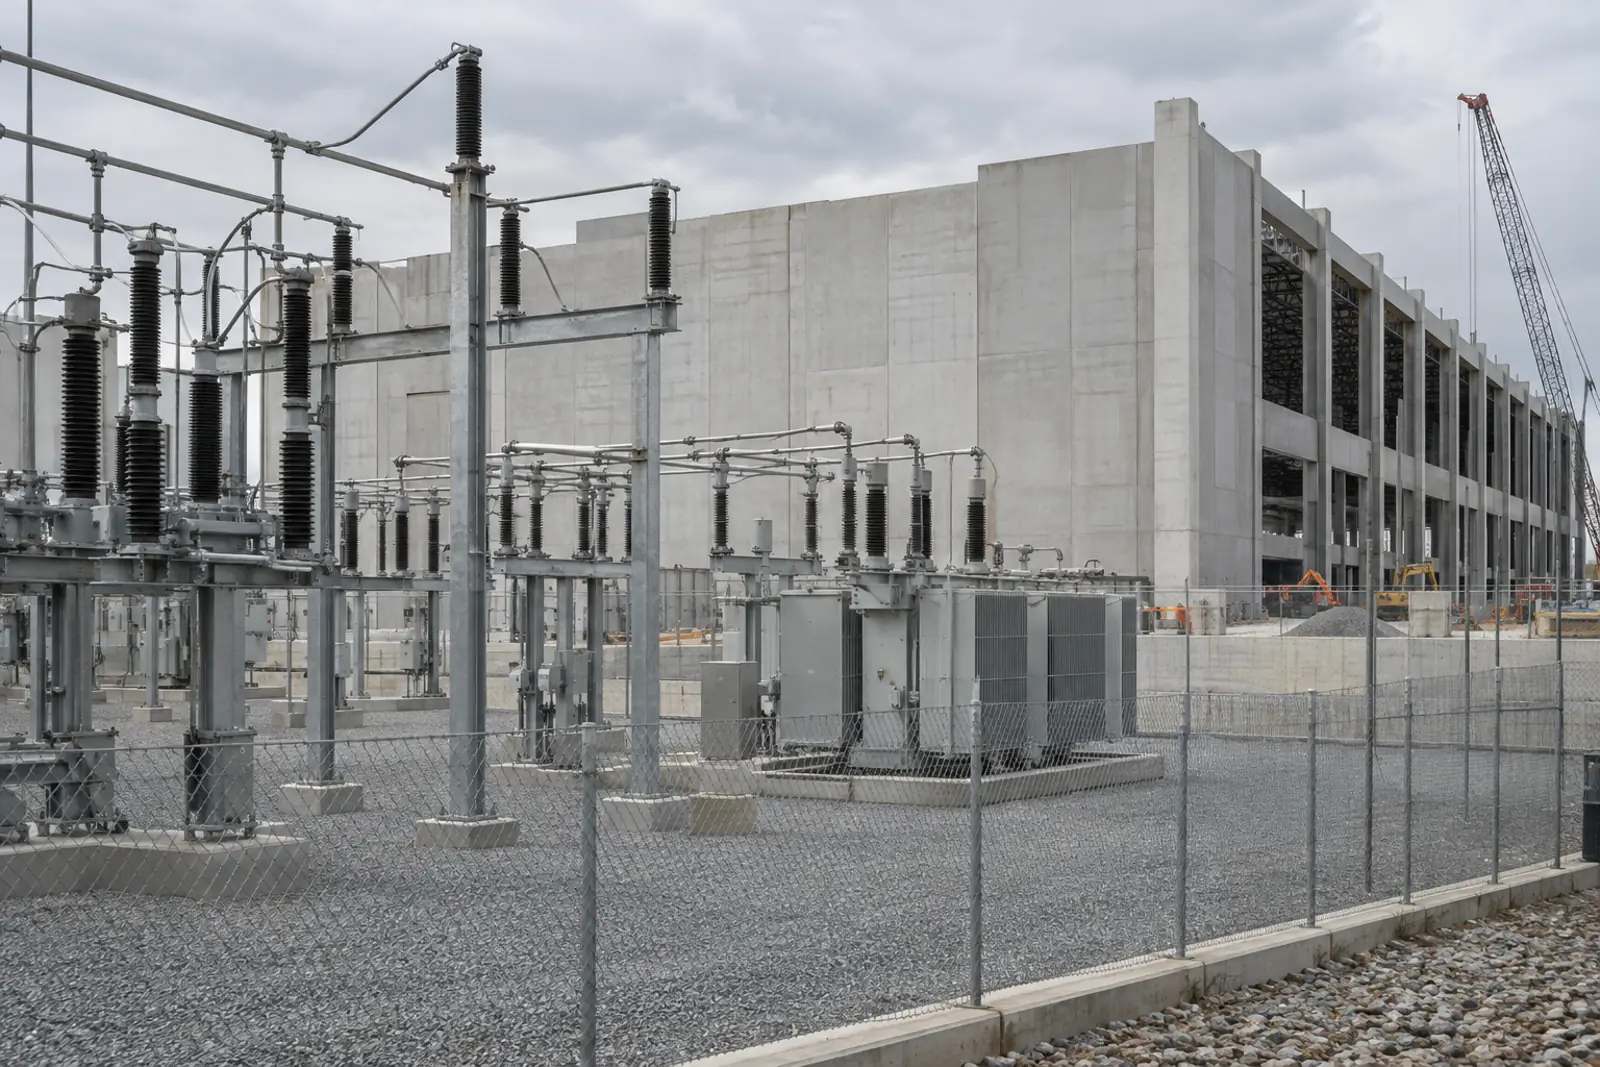
Data Center Power Demand vs. Grid Capacity: Interconnection Queues by Region, 2026
- Primary data
- LBNL Queued Up 2026 data file; LBNL US Data Center Energy Usage Report: 2025 Update; NERC 2025 LTRA
- Data period
- Queues through end of 2025; electricity estimates 2014 to 2030; grid operator figures to July 2026
- Latest release used
- 2026-10-06
- Next release
- EIA STEO 2026-11-10; NERC LTRA usually December or January; LBNL Queued Up annually
- Geography
- United States, 7 ISO/RTOs and 2 non-ISO utility regions
- Sources
- 21 (19 Tier 1)
US data center power demand reached 192 TWh in 2024, 4.7% of US electricity, and LBNL projects 9.5% to 15.3% by 2030. Generation projects waited a median 61 months from interconnection request to operation in 2025; among ISOs, from 48.0 in ERCOT to 109.6 in CAISO. NERC rates grid areas holding 54.6% of announced investment high risk by 2030.
Data center power demand and grid capacity by region, side by side
The regions differ less in how many projects want to connect than in how fast they connect them. Among the ISO/RTOs, ERCOT has the largest queue relative to its peak and the shortest wait; PJM, home to the largest data center cluster, has a queue smaller than its peak and one of the longest waits.
| Region | NERC assessment area | NERC risk, 2026 to 2030 | Active queue (GW) | 2025 peak load (GW) | Queue to peak (x) | Median request to operation (months) | Completion rate, 2000 to 2020 requests (%) |
|---|---|---|---|---|---|---|---|
| CAISO | WECC-California | Normal | 191.3 | 56.4 | 3.39 | 109.6 (2025, n=14) | 8.2 |
| ERCOT | Texas RE-ERCOT | Elevated 2026 to 2028, High 2029 on | 408.0 | 85.2 | 4.79 | 48.0 (2025, n=74) | 24.3 |
| ISO-NE | NPCC-New England | Normal 2026 to 2028, Elevated 2029 on | 14.8 | 24.9 | 0.59 | No recent sample | 17.6 |
| MISO | MISO | Normal 2026, Elevated 2027, High 2028 on | 382.2 | 122.0 | 3.13 | 73.2 (2024, n=45) | 14.0 |
| NYISO | NPCC-New York | Elevated 2026 on | 29.2 | 29.0 | 1.01 | 87.3 (2023, n=5) | 12.0 |
| PJM | PJM | Elevated 2026 to 2028, High 2029 on | 144.3 | 152.6 | 0.95 | 82.6 (2025, n=46) | 13.3 |
| SPP | MRO-SPP | Elevated 2026 on | 171.2 | 54.2 | 3.16 | 56.1 (2025, n=138) | 13.8 |
| Southeast | SERC areas (East, Central, Southeast, Florida) | SERC-East Elevated 2027 on; other SERC areas Normal | 152.9 | 185.9 | 0.82 | 54.4 (2025, n=19) | 11.5 |
| West | WECC areas outside California | WECC-Basin and WECC-Northwest High 2029 on; Southwest and Rocky Mountain Normal | 567.4 | 87.0 | 6.52 | 38.6 (2025, n=3) | 9.9 |
Queue capacity is generation and storage seeking connection at the end of 2025 (LBNL). Peak load is the 2025 regional peak (NERC via LBNL). Median request to operation uses the latest year with at least three projects. Completion rate is the capacity-weighted share of 2000 to 2020 requests that reached operation by the end of 2025. Southeast and West are non-ISO utility regions spanning several NERC areas.
Source: [4][3][5] Lawrence Berkeley National Laboratory; Lawrence Berkeley National Laboratory; North American Electric Reliability Corporation
Generation and storage requests at end of 2025 divided by 2025 regional peak
Source: CB&C calculation from LBNL Queued Up 2026 data file (tab 10; peak load from NERC)
At the end of 2025, active generation and storage requests equaled 4.79 times 2025 peak load in ERCOT, 3.13 times in MISO, 3.16 times in SPP and 3.39 times in CAISO, but 0.95 times in PJM and 0.82 times in the non-ISO Southeast (LBNL data file).
A large queue is not available power. LBNL notes that queue capacity is nameplate, that solar and wind contribute less at peak than dispatchable plants, and that most requests are withdrawn. Applying each region's historical completion rate, ERCOT's queue would still equal 116.5% of its peak, MISO's 43.7% and PJM's 12.6% (CB&C calculation, see Original synthesis).
PJM's low ratio partly reflects process: PJM paused review of new requests in 2022 until 2026 while moving to a cluster process, and CAISO, NYISO and ISO-NE accepted few or no new requests in 2025 (LBNL Queued Up 2026).
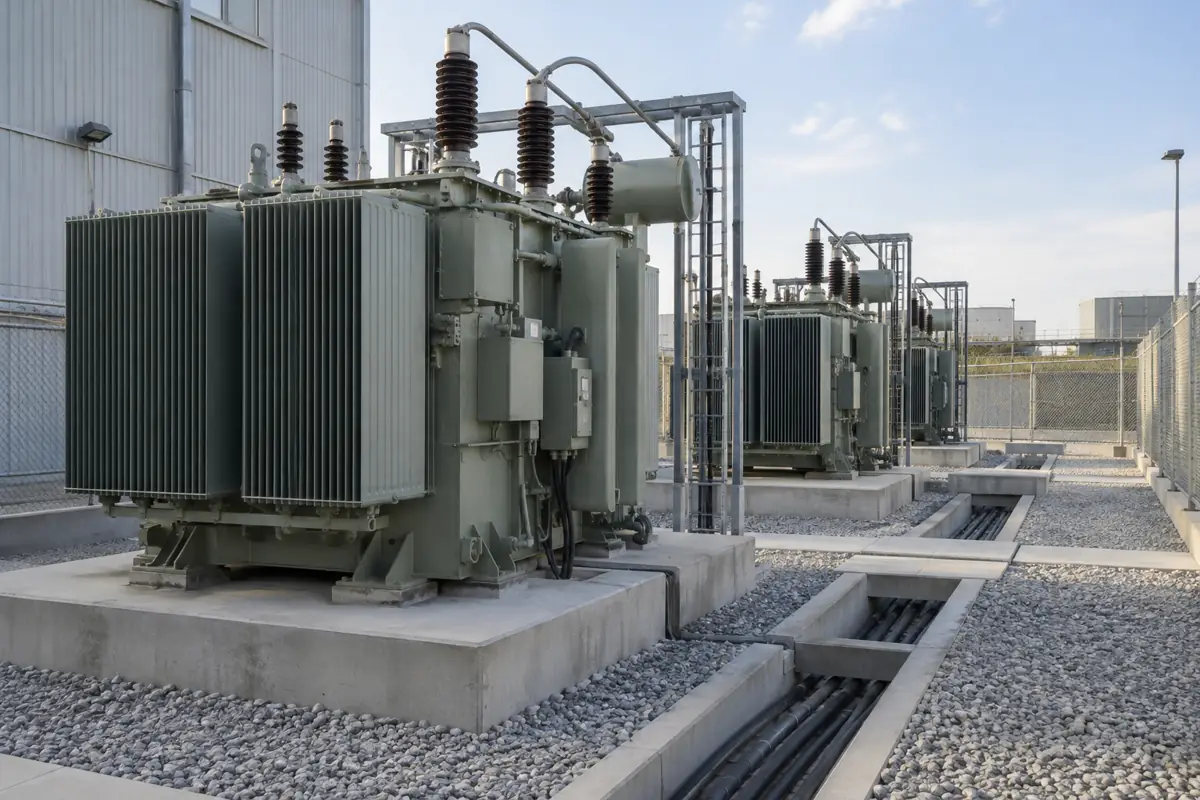
Large-load and data center interconnection requests by grid operator
Grid operators now publish large-load figures, but each measures something different. ERCOT's request volume dwarfs every other region; New England reports almost none.
| Grid operator | Published large-load or data center figure | As of | Measure | Publisher |
|---|---|---|---|---|
| ERCOT | Approximately 474 GW of large loads seeking interconnection, about 90% data centers | June 2026 | Requests | ERCOT |
| ERCOT | Approximately 205 GW eligible for the Batch Zero study (preliminary) | Data as of 2026-07-28 | Requests with qualifying studies | ERCOT |
| PJM | Summer peak forecast of 222,106 MW in 2036, up 65,733 MW in 10 years (3.6% a year); 14 zones adjusted for data center load | Posted 2026-01-14 | Load forecast | PJM |
| MISO | 26.4 GW of large-load additions in 2026 expedited reviews (17.8 GW approved, 8.6 GW proposed), up from 9.7 GW in 2025 | As of 2026-07-08 | Transmission reviews | MISO |
| SPP | Large-load (over 100 MW) request submissions peaked near 11 GW in 2022 and were about 6 GW in 2024 | Cited 2026-06-18 | Requests per year | FERC order citing SPP |
| NYISO | 51 large-load projects totaling nearly 12,670 MW; roughly 2,880 MW expected on the system by 2040 | As of 2026-05-01 | Queue and forecast | NYISO |
| ISO-NE | Two qualifying projects in CELT 2026: a 200 MW data center and an 85 MW electrification load | 2026-03-27 | Load forecast inputs | ISO-NE |
| CAISO | CEC forecast of data center load growth in the CAISO grid: 1.8 GW by 2030 and 4.9 GW by 2040 | Reported 2026-07-20 | Load forecast | CAISO citing CEC |
Measures differ by operator (requests, study eligibility, forecasts) and are not additive or directly comparable.
Source: [10][9][11][12][14][15][16] ERCOT; PJM Interconnection; MISO (hosted by Missouri PSC); Federal Energy Regulatory Commission; New York Independent System Operator; ISO New England; California ISO
ERCOT's 474 GW of large-load requests equals 5.6 times its 2025 peak of 85.2 GW. ERCOT also reported that 315 projects had no qualifying study and that approximately 205 GW is eligible for Batch Zero, the first batch study in a framework ERCOT ties to Senate Bill 6; eligible loads must post financial security of $50,000 per MW (ERCOT).
Requests overstate likely load. NERC reports that ERCOT reduced new data center projections to reflect observed use: average peak consumption at sites in service from 2022 to 2024 was 49.8% of the requested MW. After adjustments, NERC's ERCOT forecast includes 23 GW of data centers among 45 GW of large loads by 2030 (NERC).
Elsewhere: MISO's expedited reviews supported 9.7 GW of large-load additions in 2025 and 26.4 GW in 2026 (MISO); NYISO's large-load queue grew from 6 projects and 1,045 MW in 2022 to 51 projects and nearly 12,670 MW by May 1, 2026, 43.7% of its 2025 peak (NYISO); ISO-NE included two projects totaling 285 MW of nameplate in its 2026 forecast (ISO-NE); and the CEC expects data center load in the CAISO grid to grow 1.8 GW by 2030 (CAISO).
How long grid interconnection takes in each region
The median wait has nearly tripled since 2008. The spread between regions is wider than the national trend: ERCOT's connect-and-manage model keeps waits near four years while CAISO's exceed nine.
Generation and storage projects, by year they came online
Source: Lawrence Berkeley National Laboratory, Queued Up 2026 data file (tab 37), June 2026
Projects that came online in 2025 unless a year is shown
Source: Lawrence Berkeley National Laboratory, Queued Up 2026 data file (tab 38), June 2026. West n=3.
| Region | 2021 | 2022 | 2023 | 2024 | 2025 |
|---|---|---|---|---|---|
| All Regions | 50.0 (n=200) | 55.2 (n=176) | 55.7 (n=265) | 62.7 (n=335) | 60.8 (n=294) |
| CAISO | 62.5 (n=18) | 95.2 (n=13) | 100.4 (n=12) | 93.9 (n=14) | 109.6 (n=14) |
| ERCOT | 44.4 (n=54) | 46.5 (n=43) | 45.5 (n=63) | 43.5 (n=95) | 48.0 (n=74) |
| ISO-NE | |||||
| MISO | 49.5 (n=21) | 58.5 (n=25) | 58.3 (n=27) | 73.2 (n=45) | |
| NYISO | 82.0 (n=4) | 53.6 (n=9) | 87.3 (n=5) | ||
| PJM | 56.1 (n=42) | 65.4 (n=32) | 66.9 (n=64) | 70.3 (n=60) | 82.6 (n=46) |
| SPP | 57.3 (n=25) | 61.0 (n=17) | 40.3 (n=44) | 67.7 (n=56) | 56.1 (n=138) |
| Southeast | 45.1 (n=23) | 39.5 (n=24) | 51.3 (n=37) | 62.8 (n=55) | 54.4 (n=19) |
| West | 22.7 (n=13) | 66.7 (n=13) | 49.9 (n=13) | 55.6 (n=10) | 38.6 (n=3) |
LBNL Queued Up 2026 data file, tab 38. Blank cells: no projects with valid dates. Small samples (n under 20) swing widely from year to year.
Source: [4] Lawrence Berkeley National Laboratory
The national median rose from 33.5 months for projects online in 2010 to 37.8 in 2015 and 60.8 in 2025, an increase of 23.0 months in a decade (LBNL data file). LBNL's own summary rounds the 2025 figure to 61 months.
Time to the interconnection agreement alone reached a median of 44.8 months in 2025; ERCOT's was 22.1 months and SPP's 66.0. After the agreement, the median project took another 30.7 months to reach operation in 2025, and PJM's small 2025 sample took 68.1 months (LBNL data file).
ERCOT is not under FERC jurisdiction and generators there do not pay for network upgrades, which LBNL cites as a likely reason for ERCOT's higher rate of executed interconnection agreements. CAISO, ERCOT, SPP and MISO each processed more interconnection agreements in 2025 than in any prior year (LBNL Queued Up 2026).
Interconnection queue: The list of projects that have formally asked a transmission provider to connect to the grid. Each request goes through studies that identify required upgrades and assign their costs, ending in an interconnection agreement; most requests withdraw before that point.
How much queued capacity gets built
Most queued capacity never operates. About 13% of capacity requested from 2000 to 2020 was online by the end of 2025, and only ERCOT completed more than a fifth.
Capacity-weighted, requests submitted 2000 to 2020, status at end of 2025
Source: CB&C calculation from LBNL Queued Up 2026 data file (tab 25)
About 19% of projects and 13% of capacity requested from 2000 to 2020 reached commercial operation by the end of 2025. Over 750 GW withdrew in 2025 while about 600 GW of new requests arrived, and only 53 GW of the 2,290 GW active in 2024 came online in 2025, a throughput of 2% (LBNL Queued Up 2026).
The mix is shifting toward dispatchable plants that NERC counts more heavily at peak: active natural gas capacity rose 86% in 2025 to 253 GW, while solar, storage and wind requests fell (LBNL). MISO reported in August 2026 that its active generator queue stood at 167 GW, down 46% from 308 GW in December 2024, after it capped total queue size (MISO).
How much electricity US data centers use and are projected to use
LBNL raised its outlook in June 2026. Its 2028 Reference Case lands mid-range of the 2024 report, and the new 2030 range runs from roughly 2.7 to 4.4 times today's use.
| Year | Estimate or scenario | Data center electricity (TWh) | Share of US electricity (%) | Source |
|---|---|---|---|---|
| 2014 | 2024 Report (historical) | 58 | LBNL via DOE, Dec 2024 | |
| 2023 | 2024 Report (historical) | 176 | 4.4 | LBNL via DOE, Dec 2024 |
| 2024 | 2025 Update (historical estimate) | 192 | 4.7 | LBNL 2025 Update, Jun 2026 |
| 2028 | 2024 Report, low to high range | 325 to 580 | 6.7 to 12.0 | LBNL via DOE, Dec 2024 |
| 2028 | 2025 Update, Reference Case | 464 | LBNL 2025 Update, Jun 2026 | |
| 2030 | 2025 Update, Compounded Uncertainty Low | 521 | 9.5 | LBNL 2025 Update, Jun 2026 |
| 2030 | 2025 Update, Consolidated Deployment | 578 | 10.5 | LBNL 2025 Update, Jun 2026 |
| 2030 | 2025 Update, Low Accelerator Lifetime | 590 | 10.7 | LBNL 2025 Update, Jun 2026 |
| 2030 | 2025 Update, Reference Case | 649 | 11.8 | LBNL 2025 Update, Jun 2026 |
| 2030 | 2025 Update, High ASIC | 664 | 12.1 | LBNL 2025 Update, Jun 2026 |
| 2030 | 2025 Update, High Inference Energy | 782 | 14.2 | LBNL 2025 Update, Jun 2026 |
| 2030 | 2025 Update, Compounded Uncertainty High | 843 | 15.3 | LBNL 2025 Update, Jun 2026 |
2014 to 2023 values and the 2028 range are from the 2024 Report; 2024 and later values are from the 2025 Update (June 2026). Excludes cryptocurrency mining. Shares for 2030 use NERC's 2025 LTRA forecast as the denominator.
Source: [2][1] U.S. Department of Energy (LBNL 2024 Report); Lawrence Berkeley National Laboratory
Terawatt-hours; 2024 estimate was 192 TWh
Source: Lawrence Berkeley National Laboratory, United States Data Center Energy Usage Report: 2025 Update (June 2026), Table 2
Data center electricity use climbed from 58 TWh in 2014 to 176 TWh in 2023 under the 2024 Report (DOE); the 2025 Update revised history slightly down and puts 2024 at 192 TWh (LBNL). LBNL attributes 33% of total US load growth from 2024 to 2030 to data centers in its Reference Case.
Other forecasts bracket LBNL. LBNL places IEA's 2030 projection at about 430 TWh and EPRI's 2026 range at roughly 390 to 800 TWh. BloombergNEF projects 106 GW of US data center demand by 2035, a 36% upward revision, as reported by Axios. These are model estimates with different scopes and should be compared as a range.
EIA's October 2026 outlook forecasts commercial sector sales, which include data centers alongside offices and stores, rising 3.8% in 2026 to 1,549 billion kWh and 2.8% in 2027 (EIA STEO Table 7a; EIA). In Virginia, commercial sales rose nearly 30.0 million MWh from 2019 to 2025, which EIA attributes largely to data centers (EIA).
Where data center investment meets NERC reliability risk
More than half of state-allocated announced investment in the CB&C data center construction projects registry sits in states whose main grid area NERC rates high risk by 2030. The two largest single-state totals, New Mexico and Kentucky, are exceptions.
| State | Announced ($ billions) | Registry entries | Dominant grid region in LBNL queue data | NERC assessment area | NERC risk by 2030 |
|---|---|---|---|---|---|
| New Mexico | 165.0 | 1 | West (63.0% of active queue MW) | WECC-Southwest | Normal |
| Kentucky | 100.0 | 1 | Southeast (49.1% of active queue MW) | SERC-Central | Normal |
| Texas | 83.0 | 4 | ERCOT (93.3% of active queue MW) | Texas RE-ERCOT | High |
| Louisiana | 72.0 | 3 | MISO (93.9% of active queue MW) | MISO | High |
| Mississippi | 49.0 | 5 | MISO (79.6% of active queue MW) | MISO | High |
| Indiana | 39.0 | 5 | MISO (71.8% of active queue MW) | MISO | High |
| Missouri | 26.0 | 3 | MISO (50.0% of active queue MW) | MISO | High |
| Pennsylvania | 26.0 | 2 | PJM (83.5% of active queue MW) | PJM | High |
| Wisconsin | 23.3 | 4 | MISO (100.0% of active queue MW) | MISO | High |
| Michigan | 16.0 | 1 | MISO (96.8% of active queue MW) | MISO | High |
| Virginia | 15.0 | 2 | PJM (100.0% of active queue MW) | PJM | High |
| South Carolina | 11.1 | 2 | Southeast (100.0% of active queue MW) | SERC-East | Elevated |
| Georgia | 11.0 | 1 | Southeast (100.0% of active queue MW) | SERC-Southeast | Normal |
| North Carolina | 11.0 | 2 | Southeast (90.6% of active queue MW) | SERC-East | Elevated |
| Ohio | 10.0 | 1 | PJM (99.4% of active queue MW) | PJM | High |
| Oklahoma | 9.0 | 1 | SPP (95.5% of active queue MW) | MRO-SPP | Elevated |
| Iowa | 7.0 | 1 | MISO (98.9% of active queue MW) | MISO | High |
| Arkansas | 4.0 | 1 | MISO (94.1% of active queue MW) | MISO | High |
| West Virginia | 4.0 | 1 | PJM (100.0% of active queue MW) | PJM | High |
| North Dakota | 3.0 | 1 | SPP (47.2% of active queue MW) | MRO-SPP | Elevated |
| Alabama | 1.5 | 1 | Southeast (100.0% of active queue MW) | SERC-Southeast | Normal |
State totals from the CB&C registry (announced, not spent). Dominant region is the region holding the largest share of the state's active queue capacity in LBNL data. NERC risk is the highest class in 2026 to 2030 for the matching assessment area. Multi-region states are assigned to the dominant region.
Source: [20][4][5] Commercial Builders & Contractors; Lawrence Berkeley National Laboratory; North American Electric Reliability Corporation
$ billions announced January 2024 to October 2026, state-allocated entries only
Source: CB&C data center construction projects registry; LBNL Queued Up 2026 data file; NERC 2025 LTRA
NERC classes MISO as high risk from 2028 and PJM, Texas RE-ERCOT, WECC-Basin and WECC-Northwest from 2029; MRO-SPP, NPCC-New York and SERC-East are among eight elevated-risk areas (NERC 2025 LTRA). PJM's anticipated reserve margin falls from 29.7% in 2026 to 13.9% in 2030 against a reference level of 26.3%; MISO's falls to 4.3% against 8.5%.
Mapping the registry's state totals to the dominant grid region in each state's queue data, $374.3 billion (54.6%) is in high-risk areas, $34.1 billion (5.0%) in elevated-risk areas and $277.5 billion (40.5%) in normal-risk areas. Texas, Louisiana, Mississippi and Indiana lead the high-risk group.
The normal-risk total is concentrated in two entries: Project Jupiter in New Mexico (WECC-Southwest) and the Paducah campus in Kentucky (SERC-Central), which the registry records with up to 4.6 GW of dedicated generation planned. State-level mapping is approximate: Kentucky, Missouri, North Dakota and New Mexico are split among regions.
Interconnection rules: Order No. 2023 and the 2026 large-load proceedings
Federal reform has so far targeted the generator queue. Large-load rules are being set region by region, with FERC's June 2026 orders the first coordinated step.
| Date | Action | What it does | Body |
|---|---|---|---|
| 2023-09-06 | FERC Order No. 2023 published (88 FR 61014); effective 2023-11-06 | Cluster studies, first-ready first-served, site control, withdrawal penalties, penalties for late studies; generators only | FERC |
| 2026-01-14 | FERC approves SPP High Impact Large Load (HILL) process | 90-day study-and-approval path for large loads paired with generation | FERC, SPP |
| 2026-01-14 | PJM posts 2026 Load Forecast Report | Near-term large-load adjustments lowered; long-term growth kept | PJM |
| 2026-04-16 | FERC Order Regarding Intent to Act on the large-load ANOPR docket (195 FERC 61,045) | States an urgent need for large-load interconnection reforms | FERC |
| 2026-06-18 | FERC section 206 orders to six RTO/ISOs (EL26-67 to EL26-72) | Show cause on large-load tariff provisions; SPP order sets 60 days to respond, including network upgrade cost transparency and a pro forma cost recovery agreement | FERC |
| 2026-06-24 | Federal Register notices of the six proceedings (PJM notice at 91 FR 37972) | Sets refund effective date | FERC |
| 2026-07-10 | ERCOT deadline for qualifying large-load studies for Batch Zero | Batch Zero study to begin no later than September 2 | ERCOT |
Order No. 2023 covers generator interconnection; the 2026 FERC proceedings address large loads.
Source: [18][13][9][12][19][10] Federal Register / FERC; Southwest Power Pool; PJM Interconnection; Federal Energy Regulatory Commission; Federal Register / FERC; ERCOT
Order No. 2023 (88 FR 61014) requires cluster studies on a first-ready, first-served basis, site control at submission, readiness deposits and withdrawal penalties, and penalizes transmission providers for late studies (Federal Register). LBNL notes most of its 2025 data pre-date these reforms.
On 2026-06-18 FERC opened section 206 proceedings for six RTO/ISOs. In the SPP order it directed SPP and its transmission owners to respond within 60 days on whether the tariff remains just and reasonable without provisions for alternative transmission technologies, transparency on network upgrade costs for large loads and a pro forma cost recovery agreement, and asked for a 30-day report on generation adequacy (FERC, EL26-68; 91 FR 37972). SPP's HILL process, approved in January 2026, offers a 90-day study path for large loads paired with generation (SPP).
What the grid numbers mean for data center construction schedules
Power timelines now run longer than typical building timelines, so grid status is a schedule input for the trades.
With generator interconnection medians of 48.0 to 109.6 months by region and large-load studies in ERCOT now gated by financial security and batch study windows, power availability shapes when shells, substations and electrical fit-outs proceed. Announced projects and Census spending are tracked in our data center construction projects registry; workforce constraints for the electrical trades are covered in electrician shortage by state; and spending trends in commercial construction spending and warehouse construction.
Ratios behind the comparison
Projected data center share of US electricity (range across LBNL scenarios)
Formula2030 share by scenario (LBNL Table 2); growth multiple = 649 / 192; CAGR = (649/192)^(1/6) - 1
Inputs: fact rows 6, 9, 10, 11, 12, 13, 14 (fact sheet rows)
Result: 9.5% to 15.3% in 2030 (Reference Case 11.8%); 3.38 times 2024; 22.5% a year
Every LBNL 2030 scenario is at least 2.7 times the 2024 level; the width of the range (322 TWh) is larger than all data center use in 2024.
Limitations: Model projections based on equipment shipments; LBNL does not model grid power availability, so constraints in this report could hold use below the projections.
Median interconnection duration by region
FormulaMedian months from interconnection request to commercial operation, latest year with n of 3 or more
Inputs: LBNL data file tab 38 (fact row 33) (fact sheet rows)
Result: ERCOT 48.0, SPP 56.1, Southeast 54.4, MISO 73.2 (2024), PJM 82.6, CAISO 109.6; national 60.8
ERCOT connects generators in under half the time of CAISO; PJM's median rose from 56.1 to 82.6 months between 2021 and 2025.
Limitations: Generators only, not loads. Small samples in several regions; MISO has no 2025 sample and NYISO's latest is 2023 (n=5).
Capacity in queue vs current peak demand, raw and completion-adjusted
Formulaactive_queue_GW / peak_2025_GW; adjusted = active_queue_GW x completion_rate / peak_2025_GW
Inputs: fact rows 31, 32, 38; LBNL tabs 10 and 25 (fact sheet rows)
Result: Raw: West 6.52, ERCOT 4.79, CAISO 3.39, SPP 3.16, MISO 3.13, NYISO 1.01, PJM 0.95, Southeast 0.82, ISO-NE 0.59. Adjusted: ERCOT 116.5%, West 64.4%, MISO 43.7%, SPP 43.7%, CAISO 28.0%, PJM 12.6%
On a completion-adjusted basis, ERCOT's pipeline alone exceeds its peak, while PJM's would add about an eighth of its peak.
Limitations: Nameplate MW, not accredited capacity; historical completion rates may not hold under Order No. 2023; regional peaks are non-coincident.
Overlap of top data center states with NERC risk areas
FormulaSum of registry state totals by NERC risk class of the state's dominant queue region; share = class total / 685.9
Inputs: registry state totals (fact row 87), LBNL tab 03 state shares, NERC risk headers (fact rows 41, 42) (fact sheet rows)
Result: High $374.3B (54.6%); Elevated $34.1B (5.0%); Normal $277.5B (40.5%)
Excluding the two largest single entries (New Mexico and Kentucky), almost all announced dollars are in high- or elevated-risk areas.
Limitations: Announced, not spent; state-level mapping assigns multi-region states to one region; $50.0B is not allocated to a state.
Large-load requests relative to peak
FormulaERCOT: 474 / 85.2; NYISO: 12.67 / 29.0
Inputs: fact rows 66, 77, 32, 48 (fact sheet rows)
Result: ERCOT 5.6 times peak; NYISO 43.7% of peak
Load requests in ERCOT are larger than the region's entire generator queue, and most of those requests lacked completed studies.
Limitations: Requests are not forecasts; ERCOT observed new data centers using 49.8% of requested MW on average.
Where the numbers diverge
- US data centers used an estimated 192 TWh of electricity in 2024, 4.7% of US consumption (LBNL 2025 Update).[1]
- LBNL's Reference Case projects 649 TWh in 2030, 11.8% of forecast US electricity; its full range is 521 to 843 TWh, or 9.5% to 15.3% (LBNL).[1]
- The 2024 LBNL report estimated 176 TWh (4.4%) for 2023 and 6.7% to 12% for 2028; the 2025 Update's 2028 Reference Case of 464 TWh sits at 54.5% of that earlier range (DOE; LBNL).[2][1]
- LBNL estimates data centers would need 148 GW of grid interconnection capacity in 2030 at 50% utilization, an average increase of 17.4 GW per year from 2024 (LBNL).[1]
- At the end of 2025, 2,061 GW of generation and storage was seeking interconnection in the US, 10% less than a year earlier (LBNL Queued Up 2026).[3]
- The median project built in 2025 took 61 months from interconnection request to commercial operation, compared with 22 months in 2008 (LBNL).[3]
- For projects online in 2025, the median request-to-operation time was 48.0 months in ERCOT, 56.1 in SPP, 82.6 in PJM and 109.6 in CAISO (LBNL data file).[4]
- Only 24.3% of capacity requested in ERCOT from 2000 to 2020 reached operation by the end of 2025, the highest of nine regions; CAISO's rate was 8.2% (CB&C calculation from LBNL data).[4]
- Active queue capacity equals 4.79 times 2025 peak load in ERCOT, 3.13 times in MISO and 0.95 times in PJM (CB&C calculation from LBNL data).[4]
- ERCOT tracked approximately 474 GW of large loads seeking interconnection in June 2026, about 90% data centers (ERCOT).[10]
- PJM's January 2026 forecast puts its summer peak at 222,106 MW in 2036, 65,733 MW above the 10-year starting point, with data center adjustments in 14 zones (PJM).[9]
- NERC's 2025 LTRA finds 13 of 23 assessment areas face resource adequacy challenges over 10 years and says new data centers account for most projected demand growth (NERC).[5]
- Summer peak load in PJM's Dominion zone was 23,905 MW in 2025, 23% above 2019 (EIA).[8]
- States mapped to NERC high-risk areas account for $374.3 billion (54.6%) of $685.9 billion in state-allocated announced data center investment; New Mexico and Kentucky, the two largest single-state totals, map to normal-risk areas.[20][5][4]
Summary
- LBNL's June 2026 update puts US data center electricity use at 192 TWh in 2024 (4.7% of US electricity) and 649 TWh in 2030 in its Reference Case (11.8%), with a range of 521 to 843 TWh.
- The 2030 Reference Case is 3.38 times the 2024 level, an implied growth rate of 22.5% a year.
- US interconnection queues held 2,061 GW of generation and storage at the end of 2025; the median project built in 2025 took 61 months from request to operation.
- Waits differ by region: 48.0 months in ERCOT and 56.1 in SPP versus 82.6 in PJM and 109.6 in CAISO for projects online in 2025.
- Queued capacity is 4.79 times 2025 peak load in ERCOT but 0.95 times in PJM, the region with the largest data center concentration in the Dominion zone.
- NERC's 2025 LTRA rates 13 of 23 areas at elevated or high risk; MISO, PJM and ERCOT reach high risk by 2028 or 2029.
- States whose main grid area NERC rates high risk by 2030 hold $374.3 billion, or 54.6%, of state-allocated announced data center investment in the CB&C registry.
- FERC opened six section 206 proceedings on large-load interconnection on 2026-06-18; Order No. 2023 covers generators, not loads.
Questions people ask
How much electricity do data centers use?
US data centers used an estimated 192 TWh in 2024, 4.7% of US electricity, according to LBNL's June 2026 update. LBNL's Reference Case projects 649 TWh (11.8%) in 2030, within a range of 521 to 843 TWh. The figures exclude cryptocurrency mining.
How long does grid interconnection take?
For generation projects that came online in 2025, the median time from interconnection request to commercial operation was 61 months nationally (LBNL). By region it was 48.0 months in ERCOT, 56.1 in SPP, 82.6 in PJM and 109.6 in CAISO. Large loads such as data centers follow separate utility and grid operator studies with their own timelines.
Which regions have power for new data centers?
No single measure answers this. Among ISO/RTOs, ERCOT has the largest generator queue relative to peak (4.79 times) and the fastest connections, but also 474 GW of large-load requests. PJM's queue is 0.95 times its peak and NERC rates it high risk from 2029. NERC rates WECC-California, WECC-Southwest and most SERC areas normal risk through 2030.
Will data centers cause power shortages?
NERC's 2025 LTRA says new data centers account for most projected demand growth and that 13 of 23 areas face resource adequacy challenges over 10 years, with MISO, PJM and ERCOT reaching high risk by 2028 or 2029. NERC also notes that downward load revisions by ERCOT and PJM after its data collection could shrink projected shortfalls.
What is an interconnection queue?
It is the list of projects that have formally requested connection to the transmission grid. Each request is studied to identify needed upgrades and their costs before an interconnection agreement is signed. At the end of 2025, 2,061 GW of generation and storage was in US queues (LBNL).
For journalists and researchers
If you cite only a few, cite these
- LBNL Reference Case: 649 TWh, 11.8% of US electricity, in 2030 (range 9.5% to 15.3%).[1]
- Median interconnection time, 2025: 61 months nationally; 48.0 in ERCOT, 82.6 in PJM, 109.6 in CAISO.[3][4]
- Active queue capacity is 4.79 times 2025 peak load in ERCOT and 0.95 times in PJM.[4]
Most quotable statistics
- US data centers used 192 TWh of electricity in 2024, 4.7% of the national total, and LBNL projects 9.5% to 15.3% by 2030.[1]
- The median US power project built in 2025 waited 61 months from interconnection request to operation, up from 22 months in 2008.[3]
- For projects online in 2025, interconnection took a median 48.0 months in ERCOT and 109.6 months in CAISO.[4]
- ERCOT tracked approximately 474 GW of large loads seeking interconnection in June 2026, about 90% of them data centers.[10]
- Only 13% of capacity requested from 2000 to 2020 was operating by the end of 2025.[3]
- States whose main grid area NERC rates high risk by 2030 hold 54.6% of state-allocated announced US data center investment.[20][5][4]
Press summary
A new Commercial Builders & Contractors analysis compares US grid regions on their ability to connect new power as data center demand rises. Lawrence Berkeley National Laboratory estimates US data centers used 192 TWh in 2024, 4.7% of US electricity, and projects 9.5% to 15.3% by 2030. Power projects built in 2025 waited a median 61 months from interconnection request to operation, ranging from 48.0 months in ERCOT to 109.6 months in CAISO. ERCOT's queue equals 4.79 times its 2025 peak load, while PJM's is 0.95 times. ERCOT also tracked approximately 474 GW of large-load requests in June 2026, about 90% data centers. Mapping announced data center investment to NERC's 2025 reliability assessment, 54.6% of state-allocated dollars sit in grid areas rated high risk by 2030. FERC opened six large-load proceedings in June 2026. Data and tables are available under CC BY 4.0.
Suggested headlines
- Data centers used 4.7% of US electricity in 2024; LBNL sees up to 15.3% by 2030
- Power projects now wait 61 months to connect to the US grid
- Median grid connection: 48 months in ERCOT, 110 in CAISO
- Texas grid tracks 474 GW of large-load requests, 5.6 times its peak
- Over half of announced data center dollars sit in NERC high-risk grid areas
How to cite this report
Commercial Builders & Contractors. (2026). Data Center Power Demand vs. Grid Capacity: Interconnection Queues by Region, 2026. Retrieved from https://commercialbuildersandcontractors.com/data-center-power-interconnection/
Reuse license
Data and tables are licensed CC BY 4.0. Attribution: “Source: Commercial Builders & Contractors, Data Center Power Demand vs. Grid Capacity: Interconnection Queues by Region, 2026” with a link to this page.
Download the data
Every table in this report is available as a CSV under CC BY 4.0. The fact sheet lists each value with its source URL and access date.
- derived_metrics.csv (CSV)
- fact_sheet.csv (CSV)
- Regions side by side: queues, peak load, timelines, completion and NERC risk (CSV)
- Large-load and data center interconnection figures published by grid operators (CSV)
- LBNL estimates of US data center electricity use and share, 2014 to 2030 (CSV)
- Median months from interconnection request to commercial operation, by region and year online (CSV)
- Registry states by dominant grid region and NERC risk class (CSV)
- Interconnection rule changes and grid operator actions, 2023 to 2026 (CSV)
Frequently asked questions
What share of US electricity do data centers use?
LBNL estimates 4.4% in 2023 and 4.7% in 2024 (192 TWh), excluding cryptocurrency mining.
How much electricity will data centers use in 2030?
LBNL's Reference Case is 649 TWh, 11.8% of forecast US electricity, with a range of 521 to 843 TWh (9.5% to 15.3%).
How did LBNL's 2026 update change its 2028 outlook?
The 2024 report projected 325 to 580 TWh for 2028; the 2025 Update's 2028 Reference Case is 464 TWh, near the middle of that range.
How much grid capacity will data centers need?
LBNL estimates 148 GW of interconnection capacity in 2030 at 50% average utilization, an increase of 17.4 GW per year from 2024.
How much capacity is waiting in US interconnection queues?
2,061 GW at the end of 2025: 1,312 GW of generation and 749 GW of storage, compared with 1,374 GW of installed US capacity.
Which region connects generators fastest?
ERCOT, with a 2025 median of 48.0 months from request to operation and 22.1 months from request to agreement, based on LBNL data.
How many large loads are seeking to connect in Texas?
ERCOT tracked approximately 474 GW in June 2026, about 90% data centers; approximately 205 GW was eligible for its Batch Zero study.
How fast is PJM's peak demand forecast to grow?
PJM's 2026 forecast projects 3.6% a year over 10 years, to 222,106 MW in 2036, with data center adjustments in 14 zones.
Does FERC Order No. 2023 cover data centers?
No. Order No. 2023 (88 FR 61014) reforms generator interconnection. FERC addressed large loads separately in six section 206 proceedings opened on 2026-06-18.
What share of queued capacity gets built?
About 13% of capacity requested from 2000 to 2020 was operating by the end of 2025; ERCOT's rate was 24.3% and CAISO's 8.2%.
Methodology
Scope: this report compares nine US grid regions used by LBNL's Queued Up data (seven ISO/RTOs plus non-ISO Southeast and West) on generator queue size, regional peak load, interconnection duration, completion rates, published large-load figures and NERC risk class, and summarizes national data center electricity estimates. It links to, and does not repeat, the CB&C data center construction projects registry.
Source selection: primary sources only for statistics (LBNL, NERC, EIA, FERC via the Federal Register, and ISO/RTO publications), using the latest release of each as of 2026-10-18: LBNL Queued Up 2026 (June 2026, data through 2025), LBNL 2025 Update (June 2026), NERC 2025 LTRA (January 2026), EIA STEO (2026-10-06). Market research estimates (BloombergNEF via Axios; IEA and EPRI as characterized by LBNL) are shown only as comparators.
Conflicts: where LBNL's slide text and data file differ by rounding (61 vs 60.8 months for 2025), the data file value is used in tables and charts and the slide value is cited as LBNL's summary. LBNL's 2024 and 2025 reports estimate history differently; each value is labeled with its report vintage.
Derived metrics: queue-to-peak ratios divide LBNL active queue capacity by NERC 2025 peak load as published in the LBNL data file; completion rates are capacity-weighted from LBNL tab 25; the risk overlap assigns each registry state to the region holding the largest share of its active queue MW (LBNL project-level data) and then to the matching NERC area using NERC's footprint descriptions. All calculations are in scripts/ and derived_metrics.csv.
Limitations: generator queues and load queues are separate and not additive; queue MW are nameplate, not accredited capacity; small regional samples make some medians volatile; large-load figures from grid operators use different definitions; registry dollars are announcements, not spending. This report does not assess any individual site.
Last updated 2026-10-18. Planned refresh after the next LBNL Queued Up edition, the next NERC LTRA, or a FERC final action in the large-load proceedings.
This report presents published data with its limitations. It is not legal, financial or investment advice.
Sources, ranked by quality
Tier 1: primary and official sources (19)
- [1] Lawrence Berkeley National Laboratory. United States Data Center Energy Usage Report: 2025 Update. Smith et al. (2026), LBNL-2001758, June 2026. Accessed 2026-10-18.
- [2] U.S. Department of Energy (LBNL 2024 Report). DOE Releases New Report Evaluating Increase in Electricity Demand from Data Centers. DOE, 2024-12-20, summarizing LBNL 2024 United States Data Center Energy Usage Report. Accessed 2026-10-18.
- [3] Lawrence Berkeley National Laboratory. Queued Up: 2026 Edition. Rand et al. (2026), Queued Up: 2026 Edition, LBNL, June 2026. Accessed 2026-10-18.
- [4] Lawrence Berkeley National Laboratory. Queued Up 2026 data file (interconnection queue data through 2025). LBNL, Queued Up 2026 data file, tabs as noted. Accessed 2026-10-18.
- [5] North American Electric Reliability Corporation. 2025 Long-Term Reliability Assessment. NERC, 2025 LTRA, January 2026. Accessed 2026-10-18.
- [6] U.S. Energy Information Administration. Short-Term Energy Outlook: Electricity, coal, and renewables (October 2026). EIA, STEO, released 2026-10-06. Accessed 2026-10-18.
- [7] U.S. Energy Information Administration. STEO Table 7a: U.S. Electricity Industry Overview (October 2026). EIA, STEO Table 7a, October 2026. Accessed 2026-10-18.
- [8] U.S. Energy Information Administration. Commercial electricity sales have soared in Virginia, driven by data centers. EIA, Today in Energy, 2026-05-05. Accessed 2026-10-18.
- [9] PJM Interconnection. 2026 PJM Load Forecast Report. PJM, posted 2026-01-14. Accessed 2026-10-18.
- [10] ERCOT. ERCOT Update, Senate Committee on Business & Commerce. ERCOT, 2026-07-29. Accessed 2026-10-18.
- [11] MISO (hosted by Missouri PSC). MISO Quarterly Update to the Missouri Public Service Commission. MISO, 2026-08-19. Accessed 2026-10-18.
- [12] Federal Energy Regulatory Commission. Order Instituting Proceeding, Southwest Power Pool, Inc., Docket No. EL26-68-000 (195 FERC 61,213). FERC, issued 2026-06-18. Accessed 2026-10-18.
- [13] Southwest Power Pool. FERC approves SPP's large load connection proposal. SPP, 2026-01-15. Accessed 2026-10-18.
- [14] New York Independent System Operator. 2026 Power Trends. NYISO, Power Trends 2026, June 2026. Accessed 2026-10-18.
- [15] ISO New England. Final Draft 2026 Large Load Forecast. ISO-NE Load Forecast Committee, 2026-03-27. Accessed 2026-10-18.
- [16] California ISO. Informational Report on Large Loads and Co-Located Loads, Docket EL26-71. CAISO, 2026-07-20. Accessed 2026-10-18.
- [17] California ISO. ISO Board of Governors approves 2025-2026 transmission plan. CAISO, 2026-05-19. Accessed 2026-10-18.
- [18] Federal Register / FERC. Improvements to Generator Interconnection Procedures and Agreements (Order No. 2023), 88 FR 61014. FERC Order No. 2023, 88 FR 61014, 2023-09-06. Accessed 2026-10-18.
- [19] Federal Register / FERC. PJM Interconnection, L.L.C., et al.; Notice of Institution of Section 206 Proceeding (Docket EL26-67-000), 91 FR 37972. 91 FR 37972, 2026-06-24. Accessed 2026-10-18.
Tier 2: trade bodies, market research, company data (1)
- [20] Commercial Builders & Contractors. Data Center Construction Projects: US Registry 2026. CB&C registry, state totals table, checked 2026-10-05. Accessed 2026-10-18.
Tier 3: journalism and expert commentary (1)
- [21] Axios. Data centers' power demand surging faster, new analysis shows (BloombergNEF figure). Axios, 2025-12-01, citing BloombergNEF. Accessed 2026-10-18.